Read the alarm list and the alarm bar
Alarms tell you that something in the plant needs attention. You see them in two places: the alarm bar at the bottom of every screen and the alarm list on the alarm page.
Before you begin
- You are signed in. See Open the runtime screen and sign in.
Steps
1. Read the alarm bar
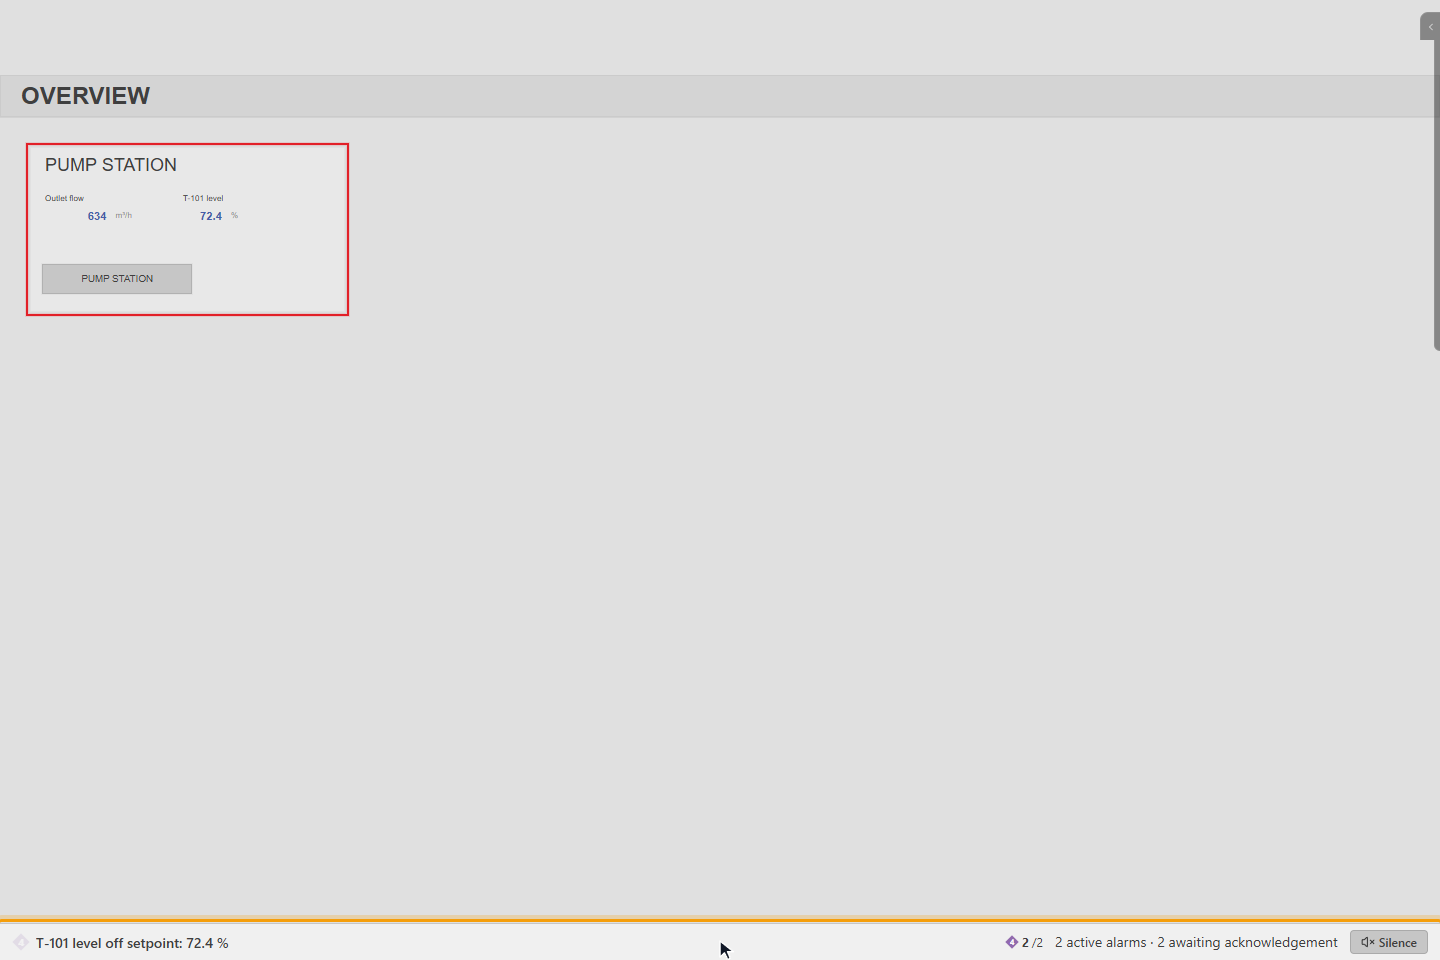
The alarm bar shows the most urgent alarm that waits for acknowledgement, here T-101 level off setpoint: 72.4 %, a counter per priority (awaiting acknowledgement / total) and the total, here 2 active alarms · 2 awaiting acknowledgement. Click the bar. The first page with an alarm list opens.
2. Read the alarm list
The Active tab lists the alarms that wait for acknowledgement, the most urgent first. From top to bottom the list has a toolbar, a row with Show acknowledged and the list tools, a time bar, the column headers, the rows and a status bar.
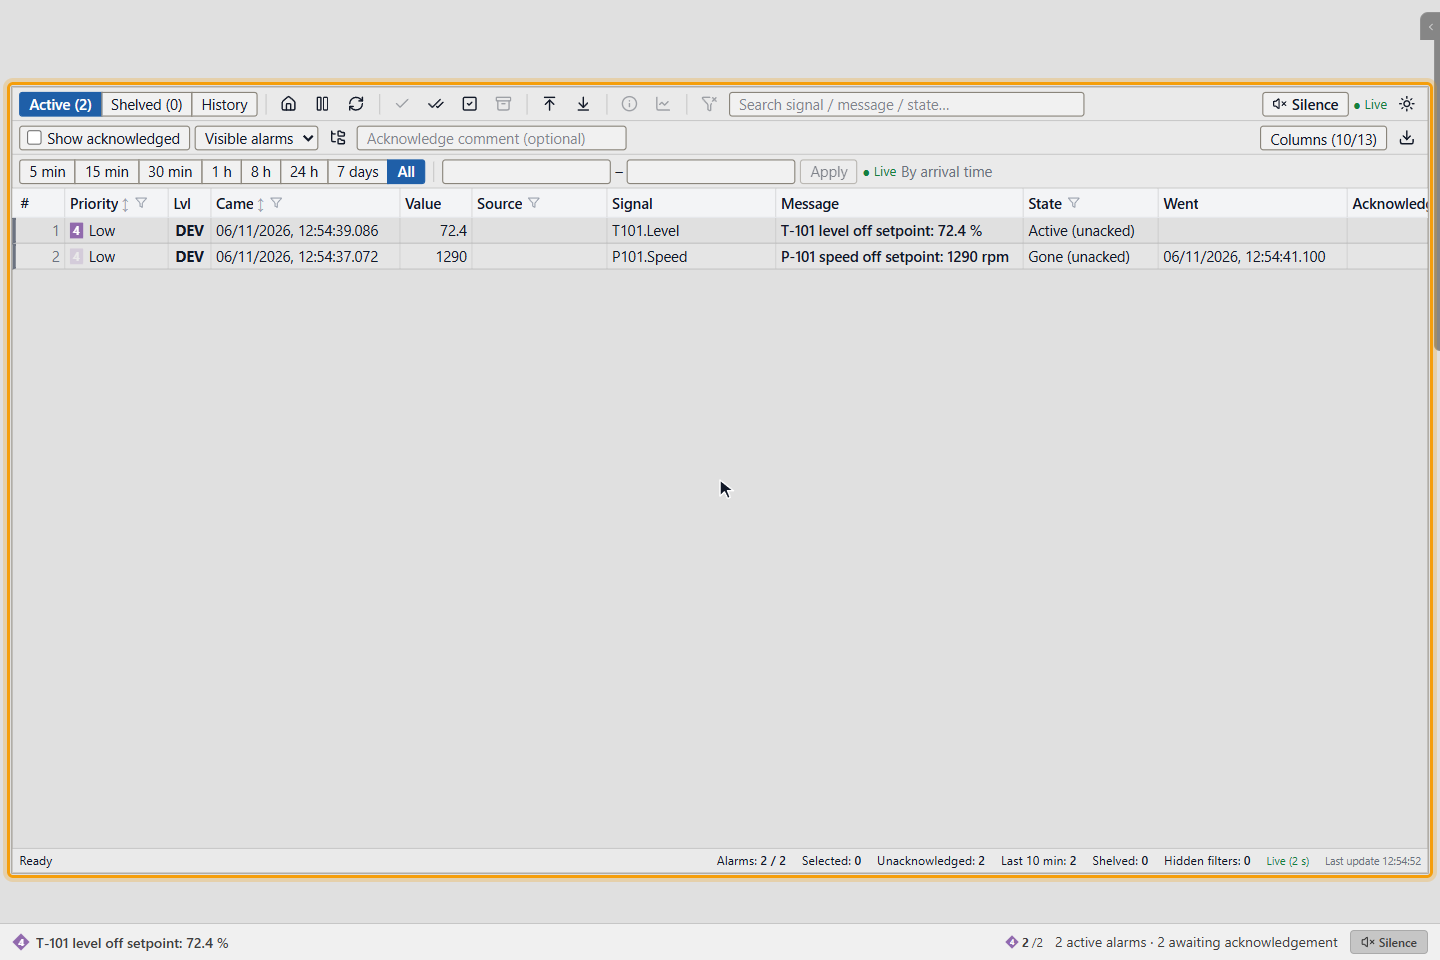
Each row shows:
| Column | Shows |
|---|---|
| # | The position in the list |
| Priority | A colored number and the priority: 1 critical, 2 high, 3 medium, 4 low |
| Lvl | The kind of limit, for example DEV for a deviation from a setpoint |
| Came | When the alarm came |
| Value | The value when it came |
| Source | Where the value came from: Auto, Field, Manual or Simulated |
| Signal | The signal of the alarm |
| Message | What happened |
| State | Active (unacked), Acknowledged or Gone (unacked) |
| Went, Acknowledged by | When the condition cleared, and who acknowledged it |
Area, Device time and Arrival at SCADA are hidden by default; Columns (n/m) shows them. To the right of the columns, Acknowledge acknowledges one row. The row of an unacknowledged alarm is bold and blinks: fast while the condition is present, slow when it has gone.
The toolbar buttons show their name when you point at them:
| Button | Effect |
|---|---|
| Active (n), Shelved (n), History | Switch the tab. Active (n) counts every active alarm, also the acknowledged ones. |
| Default view (house) | Resets the filters, the sort order and the scrolling |
| Pause, Run | Pause freezes the list; Run returns to live updates |
| Refresh | Reads the list again |
| Acknowledge selected (n), Acknowledge visible (n), Acknowledge all (n) | See Acknowledge alarms |
| Shelve selected (n) | See Shelve alarms |
| To top, To bottom | Scroll the list |
| Signal details, Open in trend | Work on the selected row |
| Clear filters | Removes the column filters, the search, the list view and the time range |
| Silence | Appears while the horn sounds |
| White background, Screen-color background | Switch the background of the list |
The status bar shows the state of the list, Alarms: (filtered / total), Selected:, Unacknowledged: for the whole project and Last 10 min:, the alarms that came in the last ten minutes. Shelved: and the counters of other hidden alarms open those alarms when you click them. Hidden filters: counts filters on hidden columns. The last fields show Live (2 s) or Stopped, and the time of the last update.
3. Filter the list
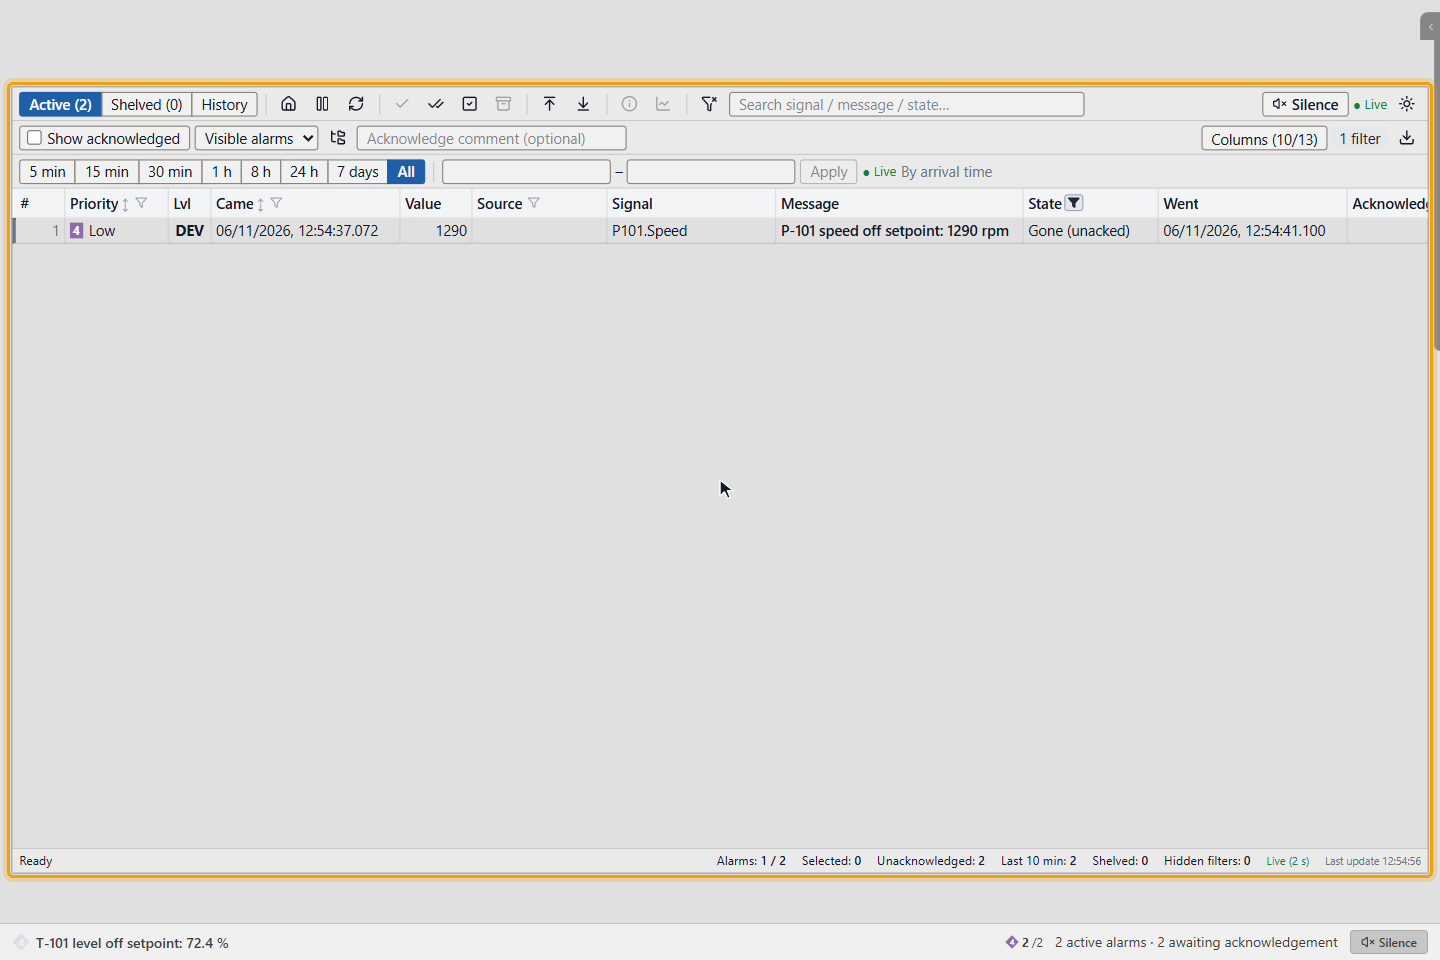
Click the funnel next to a column name, tick a value and click Apply. Priority, Came, Source, State and Area have a funnel. Here State is set to Gone (unacked): only the P-101 alarm stays. Its speed is back in the normal band, but nobody has acknowledged it yet.
You can narrow the list in these ways too:
- Show acknowledged is off by default, so the list shows only alarms that wait for acknowledgement. Turn it on to see the acknowledged alarms that are still active. The setting is kept for you and this list. A filter on State decides instead; clicking Show acknowledged removes that filter.
- The time bar limits the list by Came. Click 5 min, 15 min, 30 min, 1 h, 8 h, 24 h or 7 days, or type a start and an end and click Apply. All is the default and also lists old alarms that are still active.
- The search box Search signal / message / state… finds alarms by their message or signal.
- Area filter (area + sub-areas), the tree button, limits the list to a part of the plant.
- The list view box, which shows Visible alarms by default, shows hidden alarms: All hidden, Shelved, Out of service and Suppressed.
Click the Came header to sort by the newest or the oldest first. Click Priority to return to the default order: unacknowledged alarms first, then priority, then newest.
4. Download the list
Click Download, the arrow button next to Columns. Choose a format:
| Format | Contains |
|---|---|
| Excel (.xlsx), CSV (.csv) | The rows that match the filter, at most 1,000,000 |
| HTML report (.html) | The rows that match the filter, at most 20,000 |
| Image (.png) | The visible area of the list |
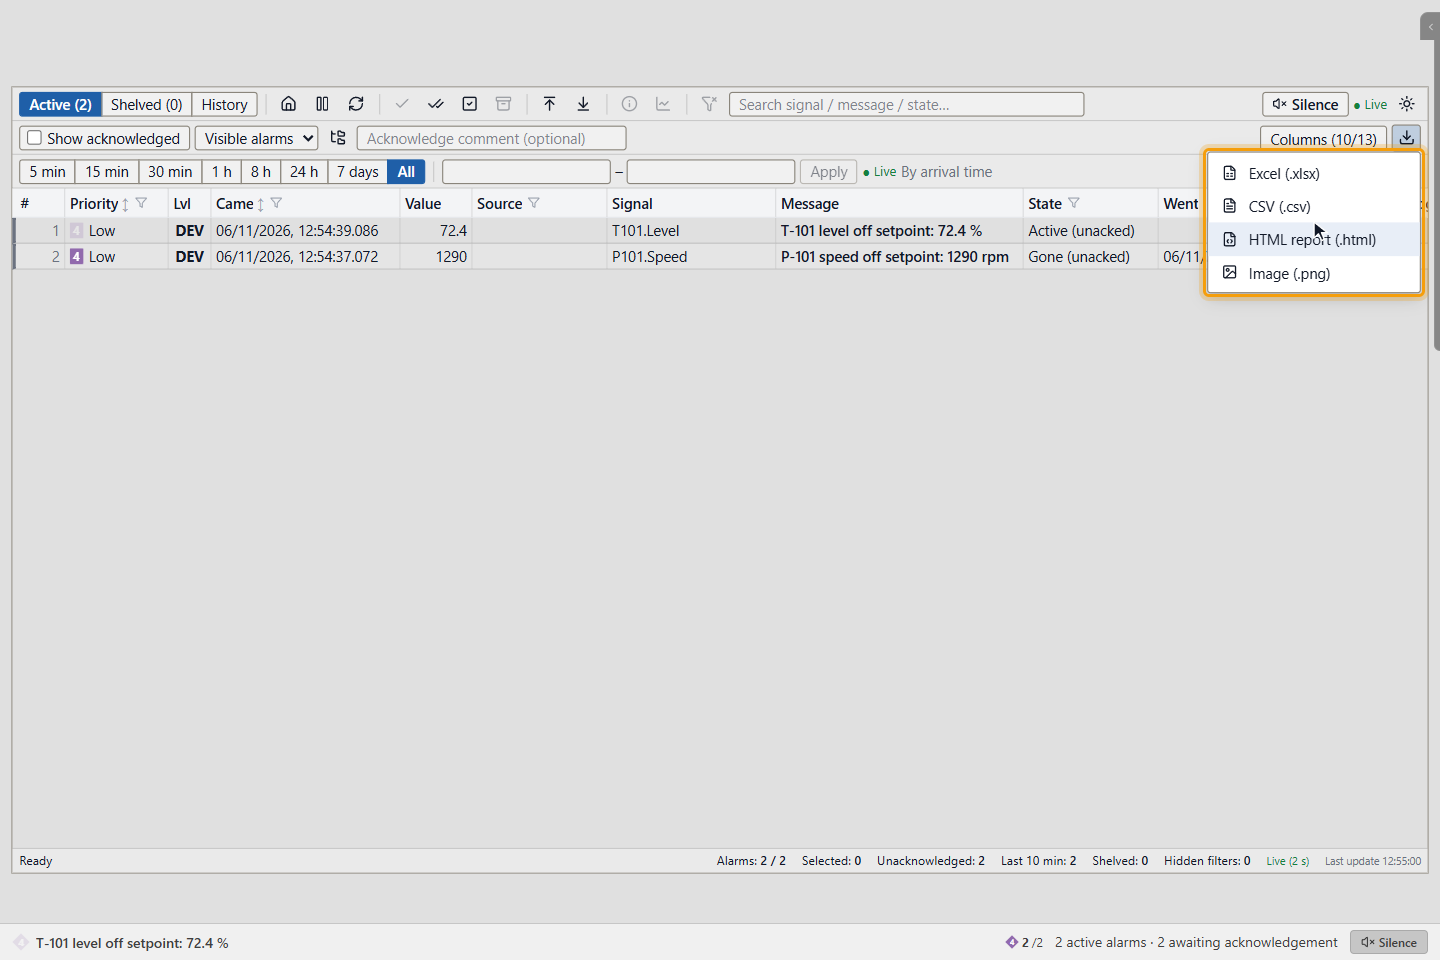
The files are named aktif-alarmlar with the extension of the format. Excel and CSV use the visible columns, except
Source, Device time and Arrival at SCADA, which they leave out.
5. Look at the history
Click History. It lists the events of the alarms, newest first: when they Came, were Acknowledged and Gone, with the priority, value and message. The time bar starts at 24 h. See Search and export the alarm history.
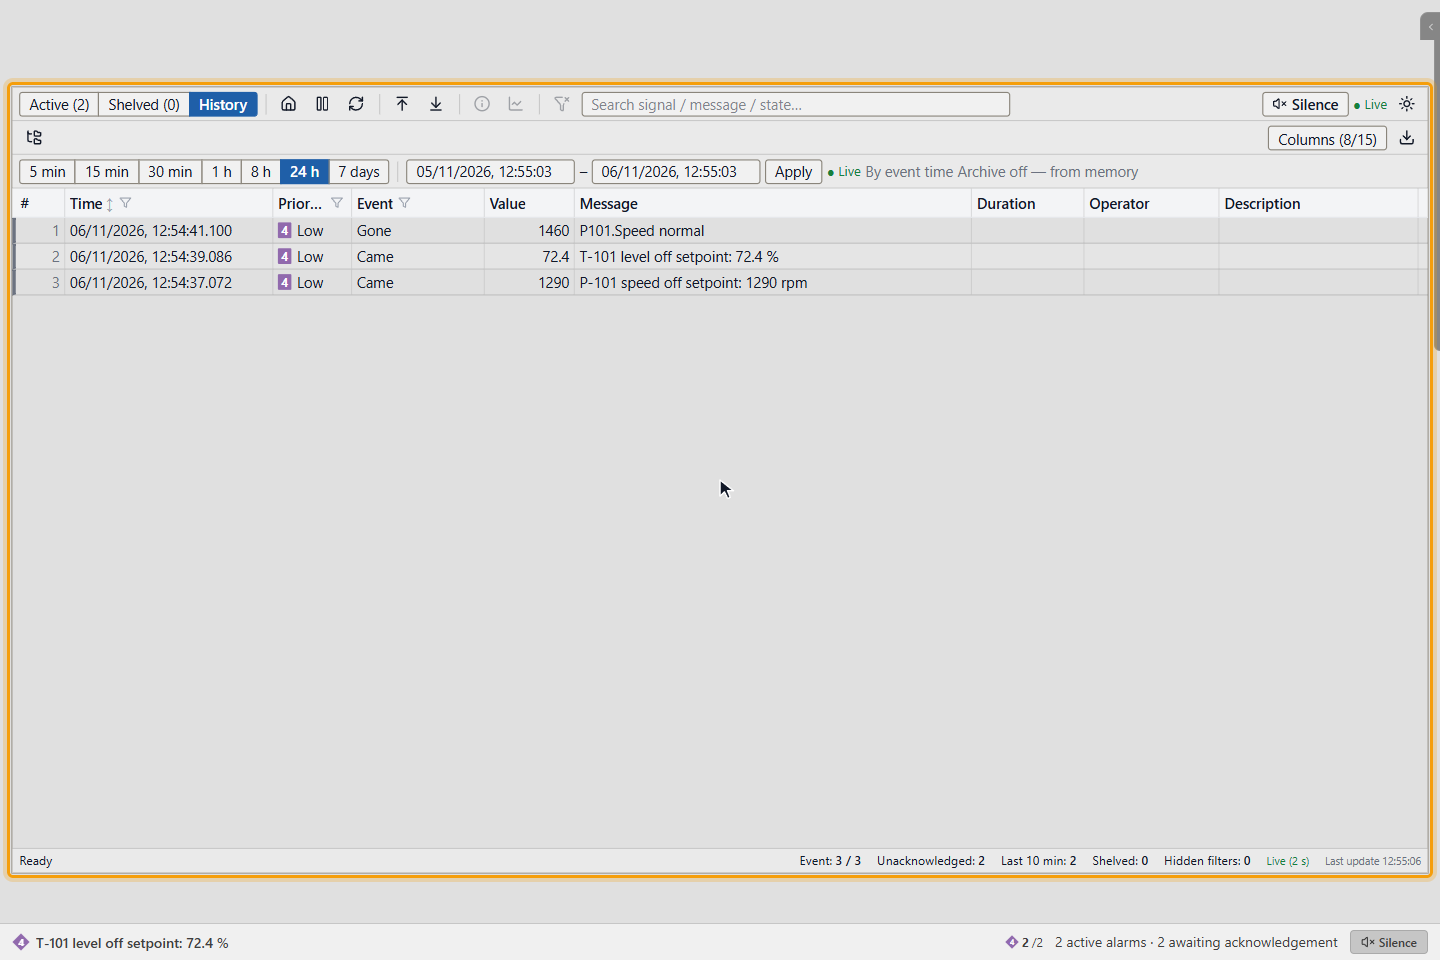
Click Active to go back to the list of active alarms.
6. When a device stops communicating
When a device stops communicating, a High priority communication alarm comes for the device, here Main PLC. It goes to the top of the list. The values of that device turn pink and a dot appears on the handle of the control rail. See Read values and states.
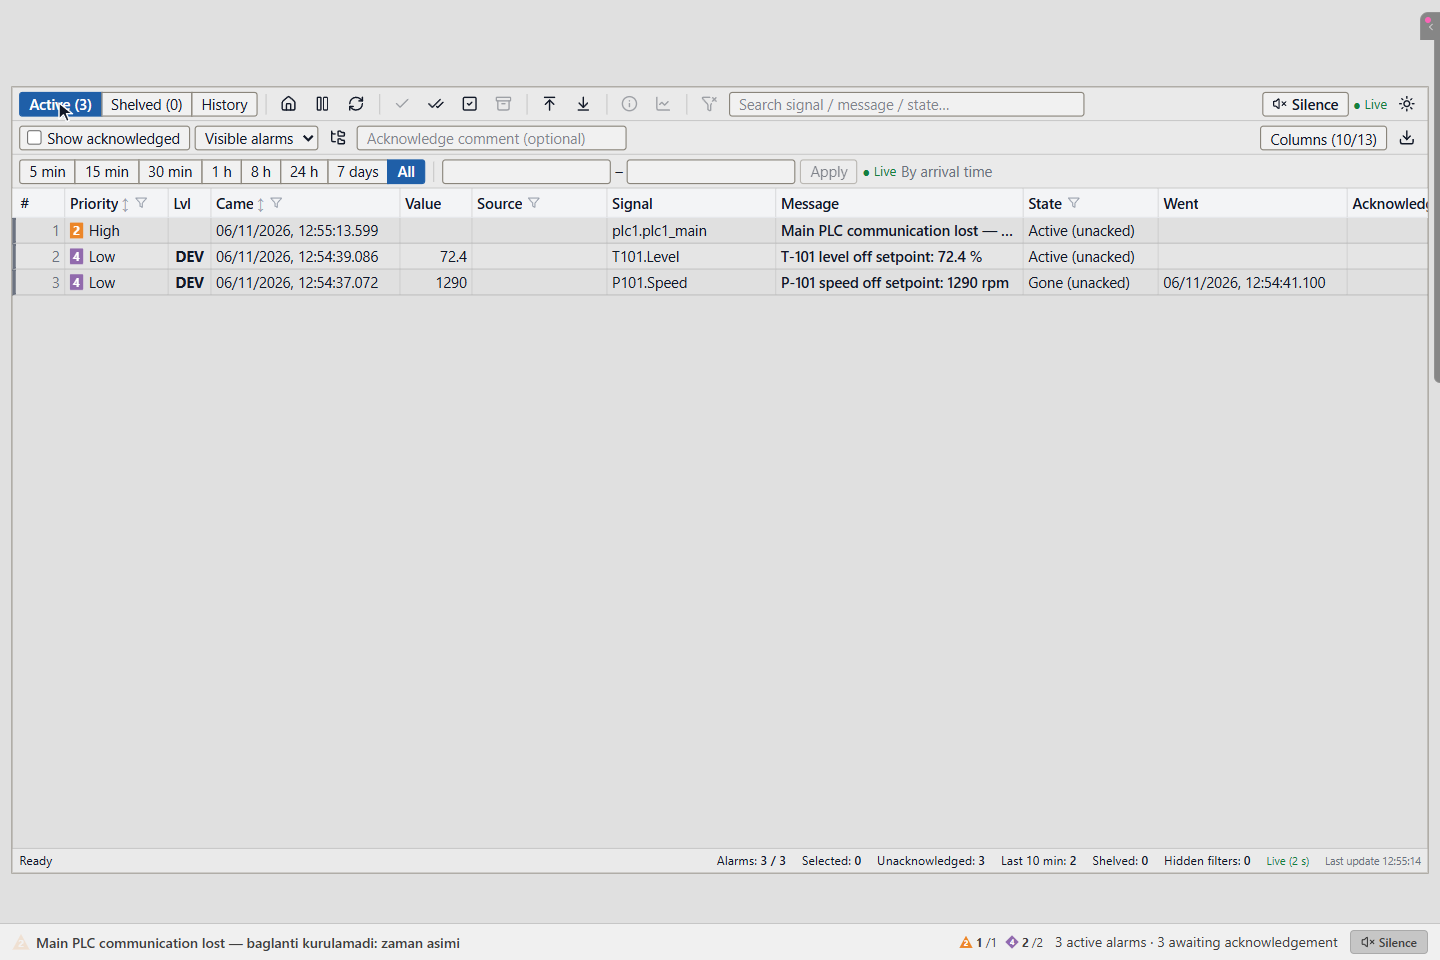
Alarm messages created by YTCC itself, such as communication, driver and failed-command alarms, are in the project's Operator language, for example Main PLC communication lost — … or Command failed: <tag> ← <value> · <user> · <reason>. Messages written by your project engineer are in the language they were written in.
Result
You know which alarms wait for acknowledgement, which are still active and what happened before. To acknowledge them, see Acknowledge alarms.
Good to know
- A row marked CHATTERING came repeatedly in a short time. FLOOD means that it came during an alarm flood, when more alarms came than the limit for ten minutes.
- Silence stops the horn only; the alarms still wait for acknowledgement.
- Your columns, filters, sort order and search are kept for you and this list. With user login they follow you to other stations.