Look at the details of a signal
The signal details panel shows everything about one signal without leaving the screen: its name, address, live value, quality and times, its configuration and its recent history. Use it to answer "why is this value pink?" or "where does this number come from?". The panel only reads; the configuration is changed by your project engineer.
Before you begin
- You are signed in to the runtime screen. See Open the runtime screen and sign in.
Steps
1. Open the signal details
Right-click an object that shows a signal, here the value under OUTLET FLOW. The menu shows the signal name, here Station.OutletFlow, with Signal details and Manual value…. Click Signal details.
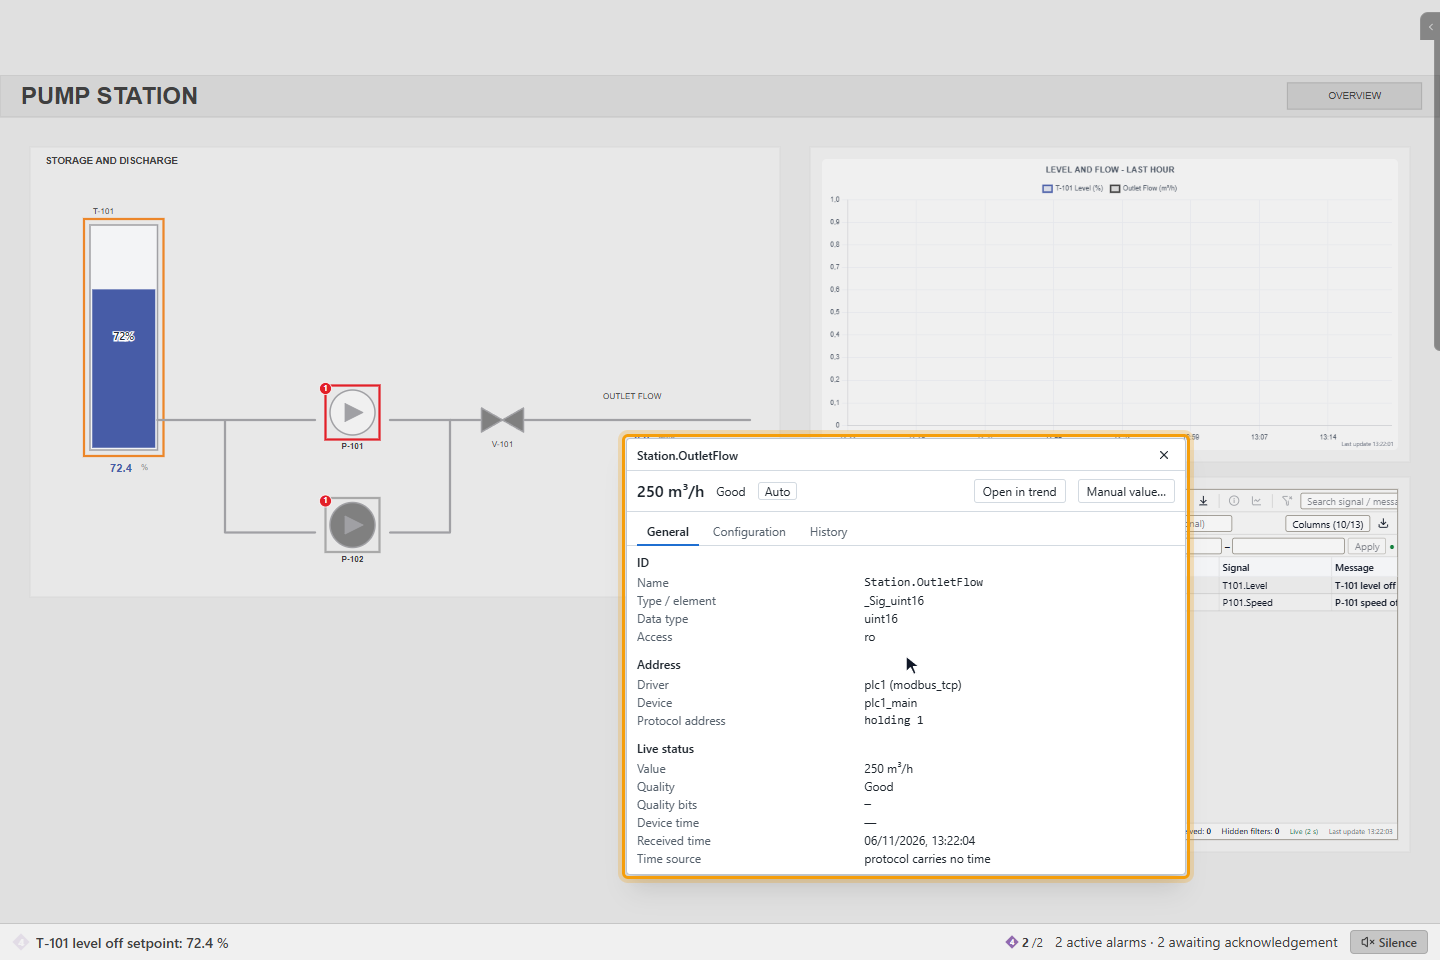
The header shows the value and unit, the quality (Good), where the value comes from (Auto, or M for a value
entered by hand) and, if there is one, the state of the last command. For a signal with named states, the header and
Live status show the value with the text of its state, for example 2 · ON. Open in trend opens the signal in the
trend screen; Manual value… and Open in editor appear only if your user may use them.
The General tab has three parts:
- ID: the name, the signal type, the data type and the access (ro read only, rw read and write).
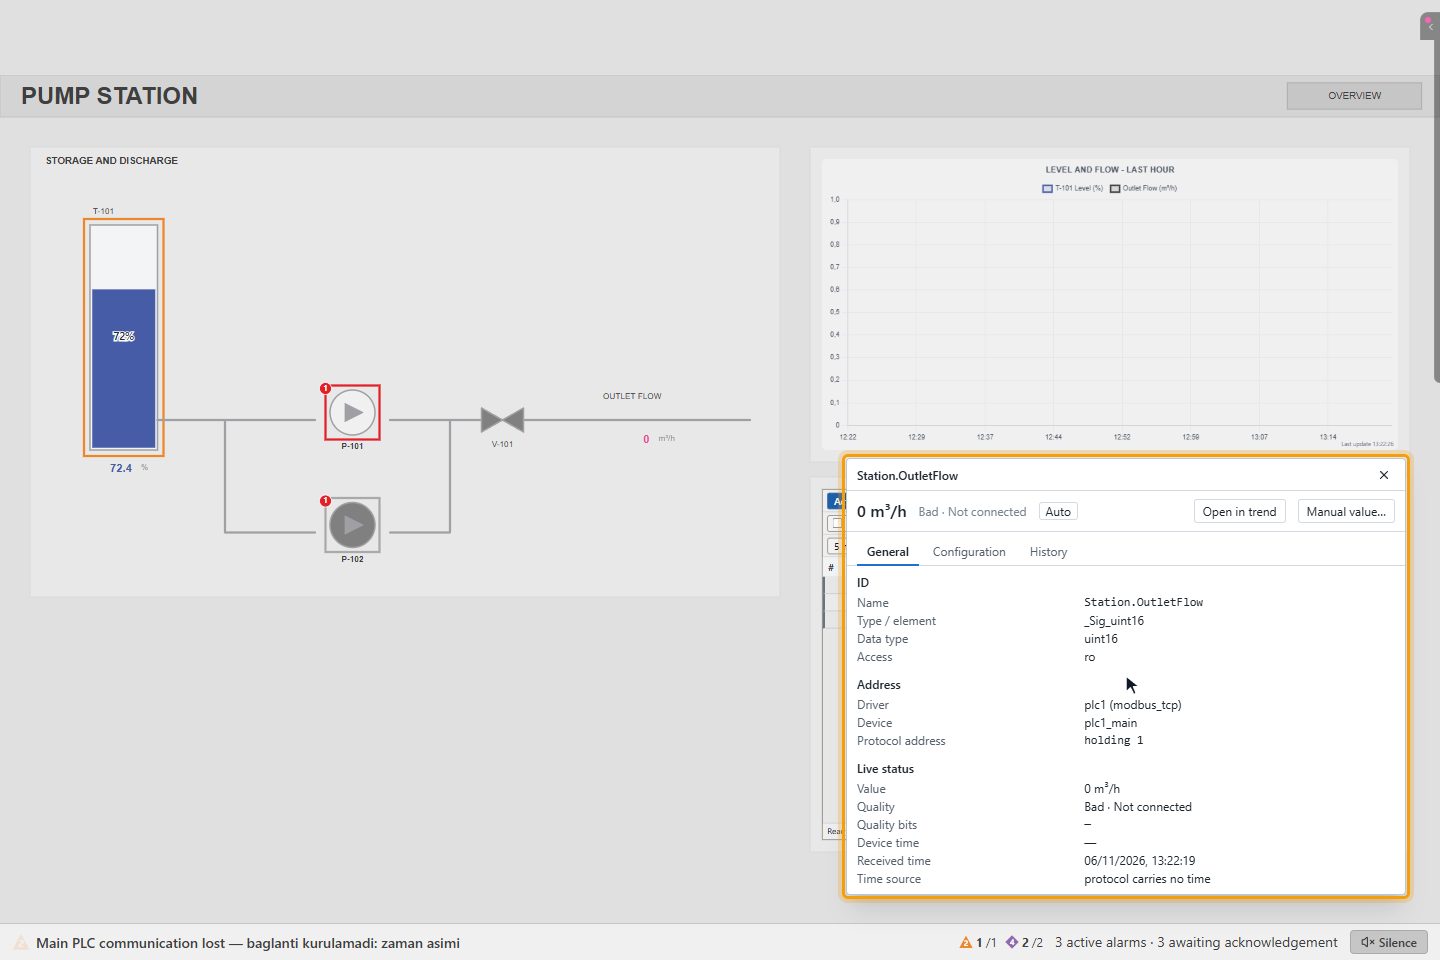
- Address: the driver, the device and the protocol address, here plc1 (modbus_tcp), plc1_main and holding 1. A signal that lives inside YTCC shows No source.
- Live status: the value, the quality, the quality bits, the Device time, the Received time (when YTCC got the value) and the Time source. Here protocol carries no time: Modbus sends no time stamp, so only the received time is known.
2. Read the configuration
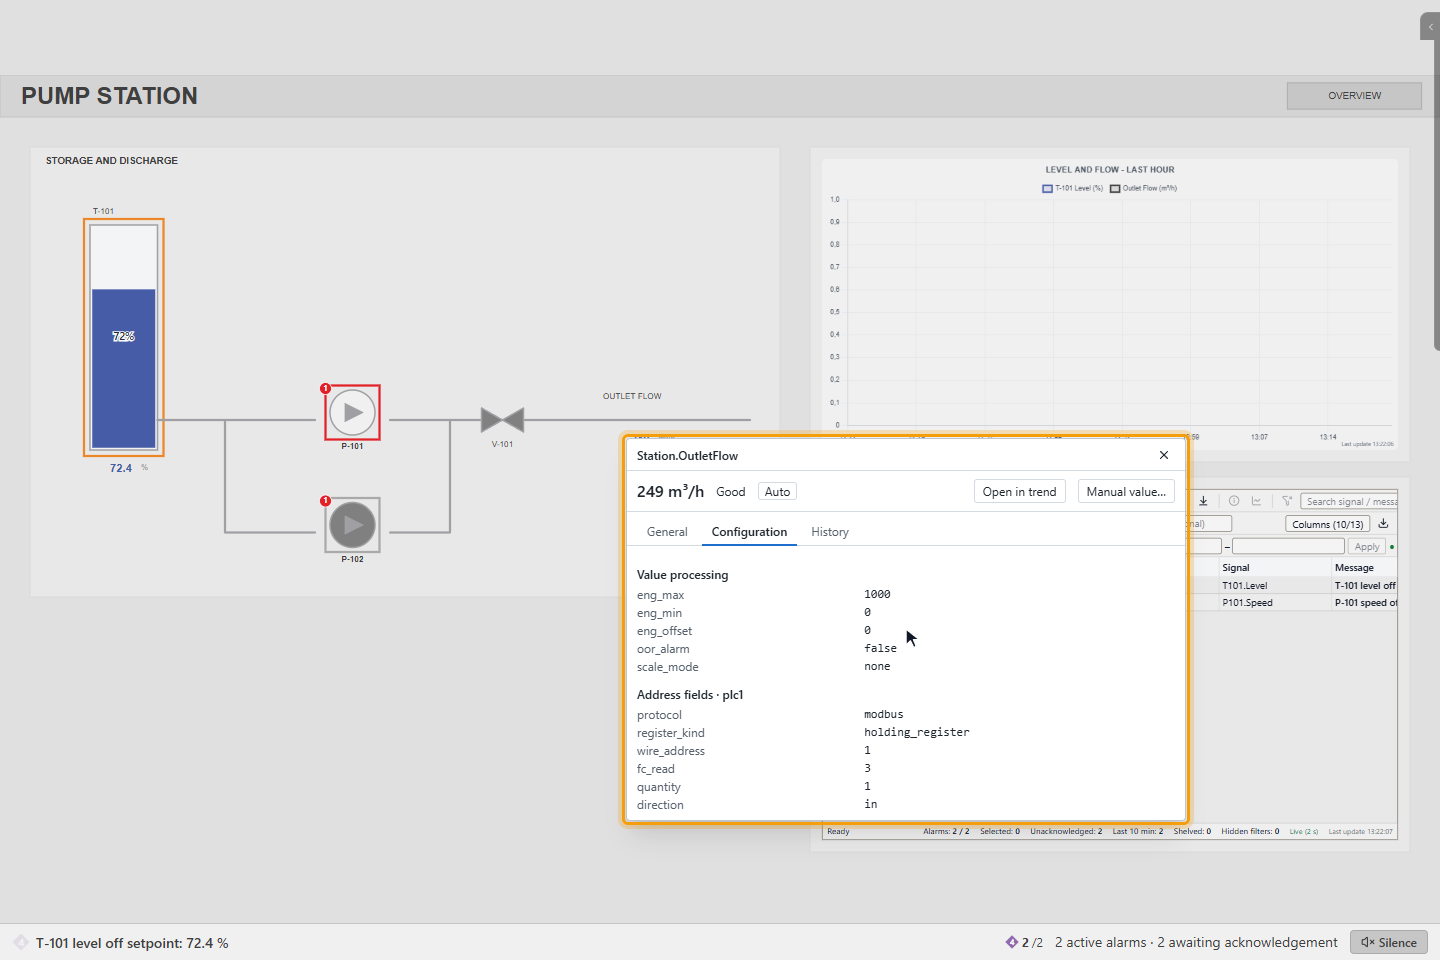
Click Configuration. It lists how the value is processed (range, scale, offset) and the fields of the protocol address. The write limit, the command, alarm and archive settings are listed when the signal has them.
3. Look at the history
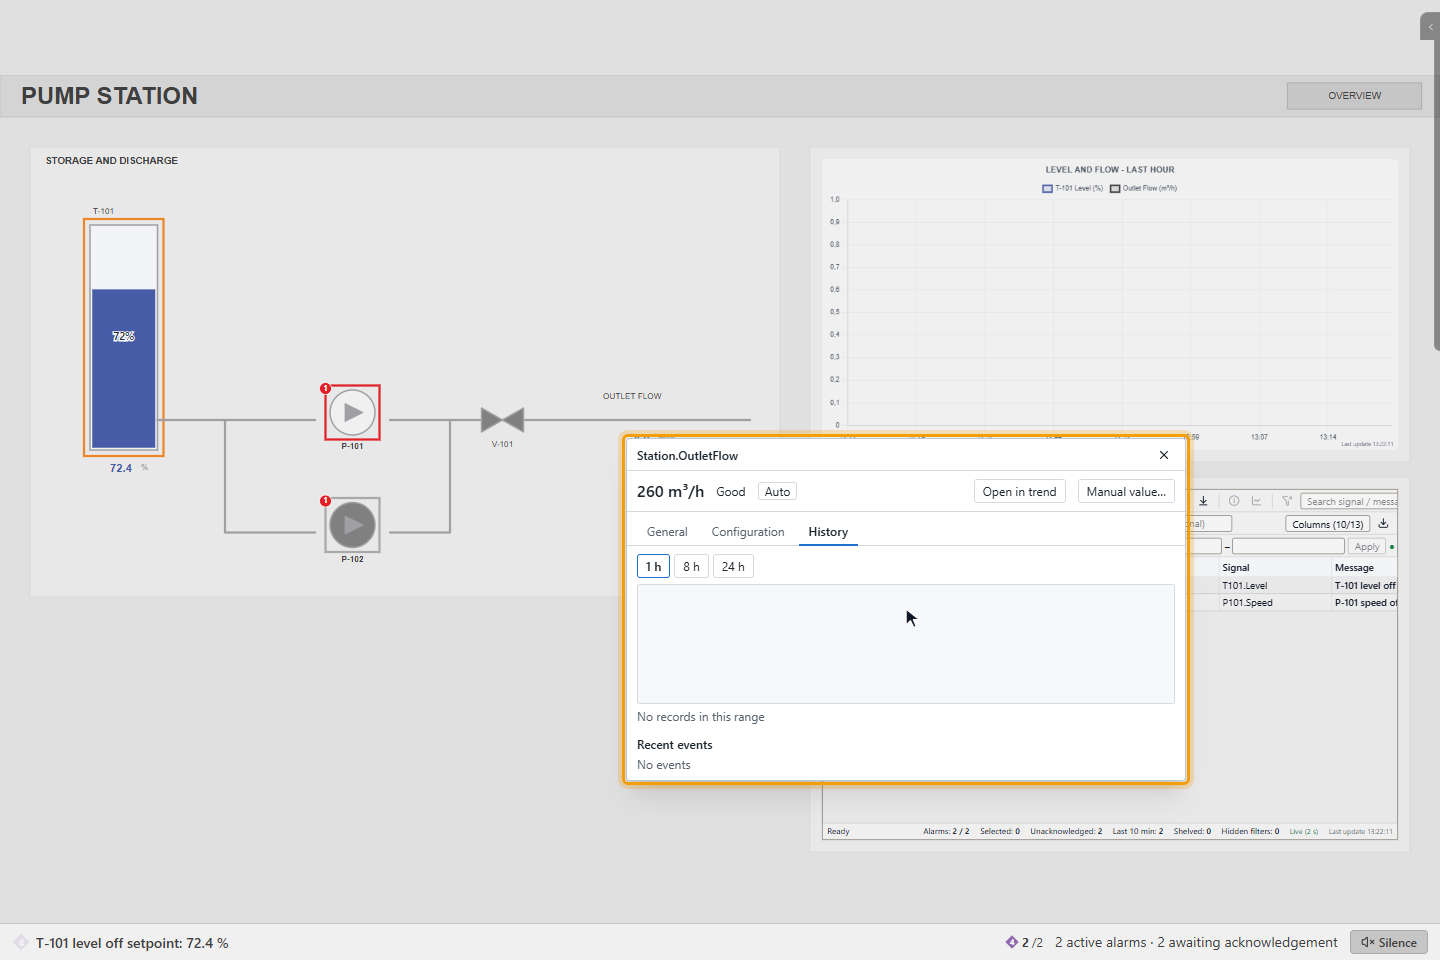
Click History. It shows the trend of the last 1 h, 8 h or 24 h and the Recent events of the signal: value changes, alarms, commands and mode changes, with the user who made them. The tab loads when you open it.
4. Open a second panel from a symbol
A symbol can show several signals, here pump P-101. Right-click the part you are interested in: the menu Select a signal lists the signals of the part under the pointer, the main one first. If that part has no signal, the menu shows the only signal of the symbol. Point at a signal, here P101.Running, and click Signal details. The new panel opens beside the first; up to four panels can be open, and the oldest closes when you open a fifth. Drag a panel by its title.
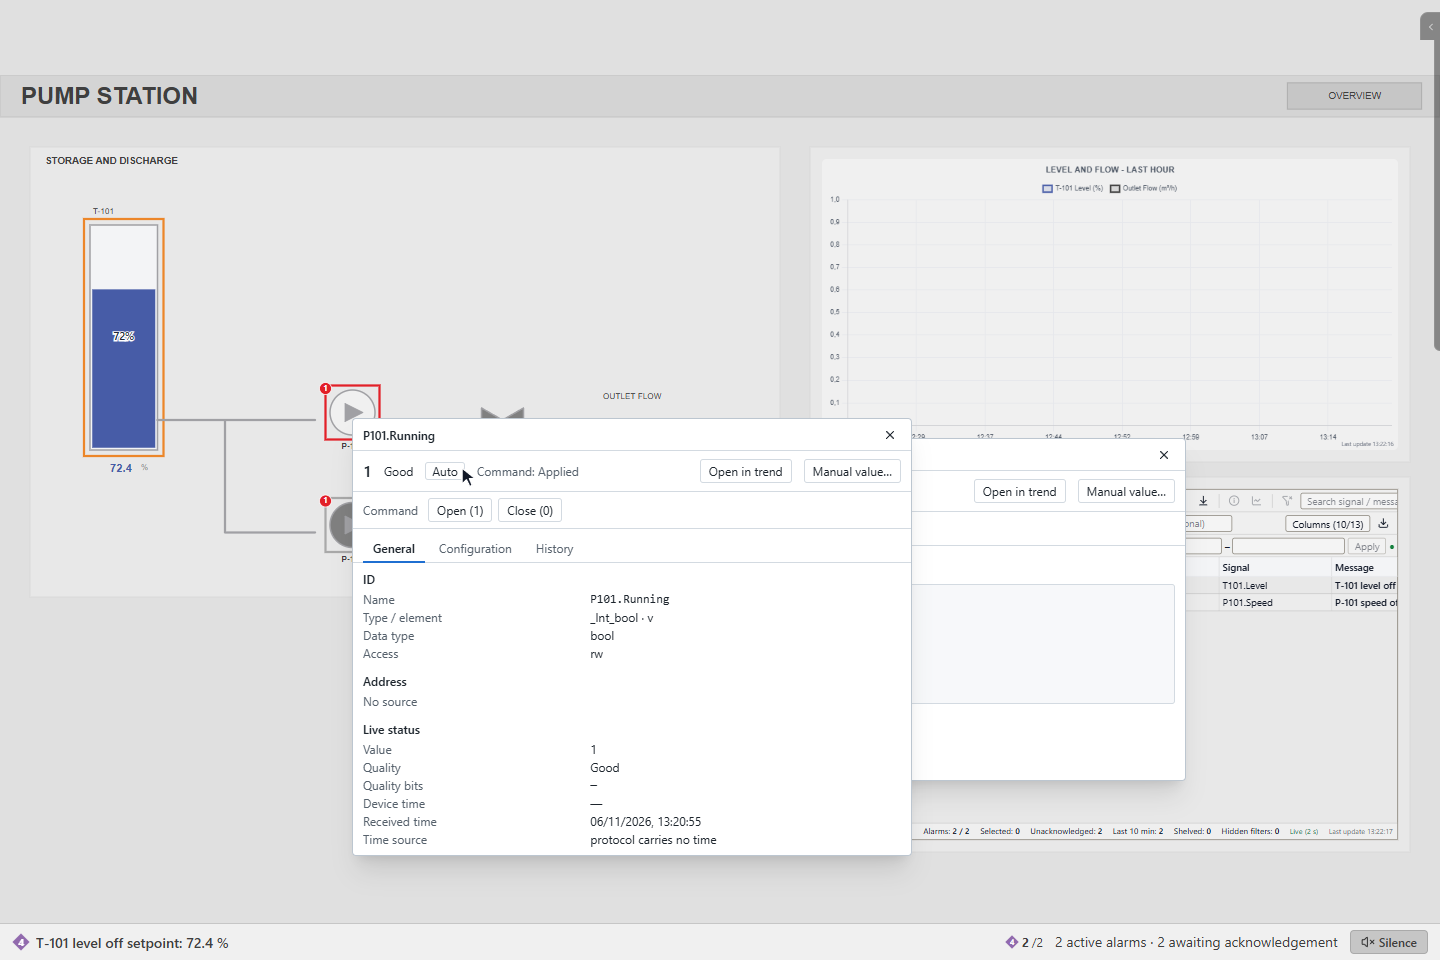
For a signal you may write, the panel has a Command row, here Open (1) and Close (0); a number signal has a value box and Send. A command from here is confirmed like any other; see Send commands.
5. When the device stops communicating
The panel is live. When Main PLC stops communicating, the header of Station.OutletFlow shows Bad · Not connected and the value on the page turns pink. Here the panel of P101.Running is closed and the other panel is dragged aside.
Do not use a value whose quality is Bad; see Read values and states.
Result
You know where a value comes from, how good it is and what happened to it recently.
Good to know
- In the alarm list, the alarm history and other lists, double-click a row to open the details of its signal. Alarms created by YTCC itself, such as a communication alarm, have no signal and open no panel.
- If your project gave the right-click of an object another action, use Ctrl + right-click to reach Signal details.
- Your project engineer can turn the panel off, or allow it only from the lists, and can remove Open in editor from it for all users; see Project settings.