Use the trend
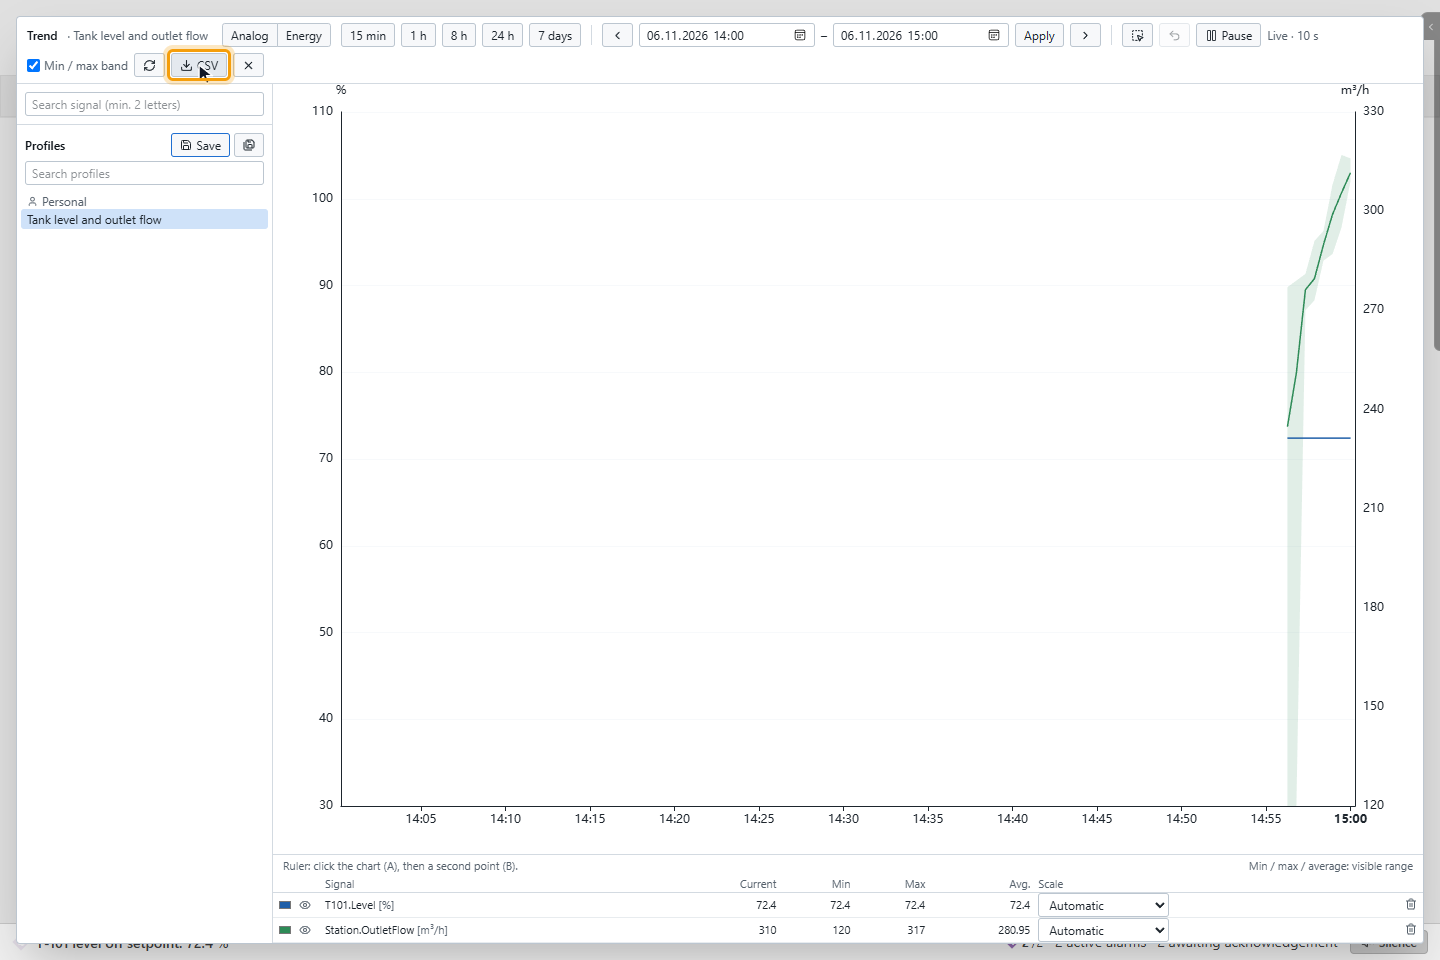
The trend shows the history of signals you choose, at any time, without a prepared page: for example the tank level and the outlet flow over the last hour, to see how one followed the other. A second view, Energy, shows the energy produced or consumed per hour, day or month.
Before you begin
- The project runs and you are signed in. The signals are recorded in the history. When the history of a signal cannot be read, the trend shows ! with History unavailable for it.
Steps
1. Open the trend
Move the mouse to the top right corner of the screen to show the control rail, click Settings and then Trend. You can also open it in these ways:
- with Open in trend in the signal details;
- with Plot in trend in a signal list (see Work with lists);
- with a button the designer set up with the action Open Trend. The button can open a saved profile.
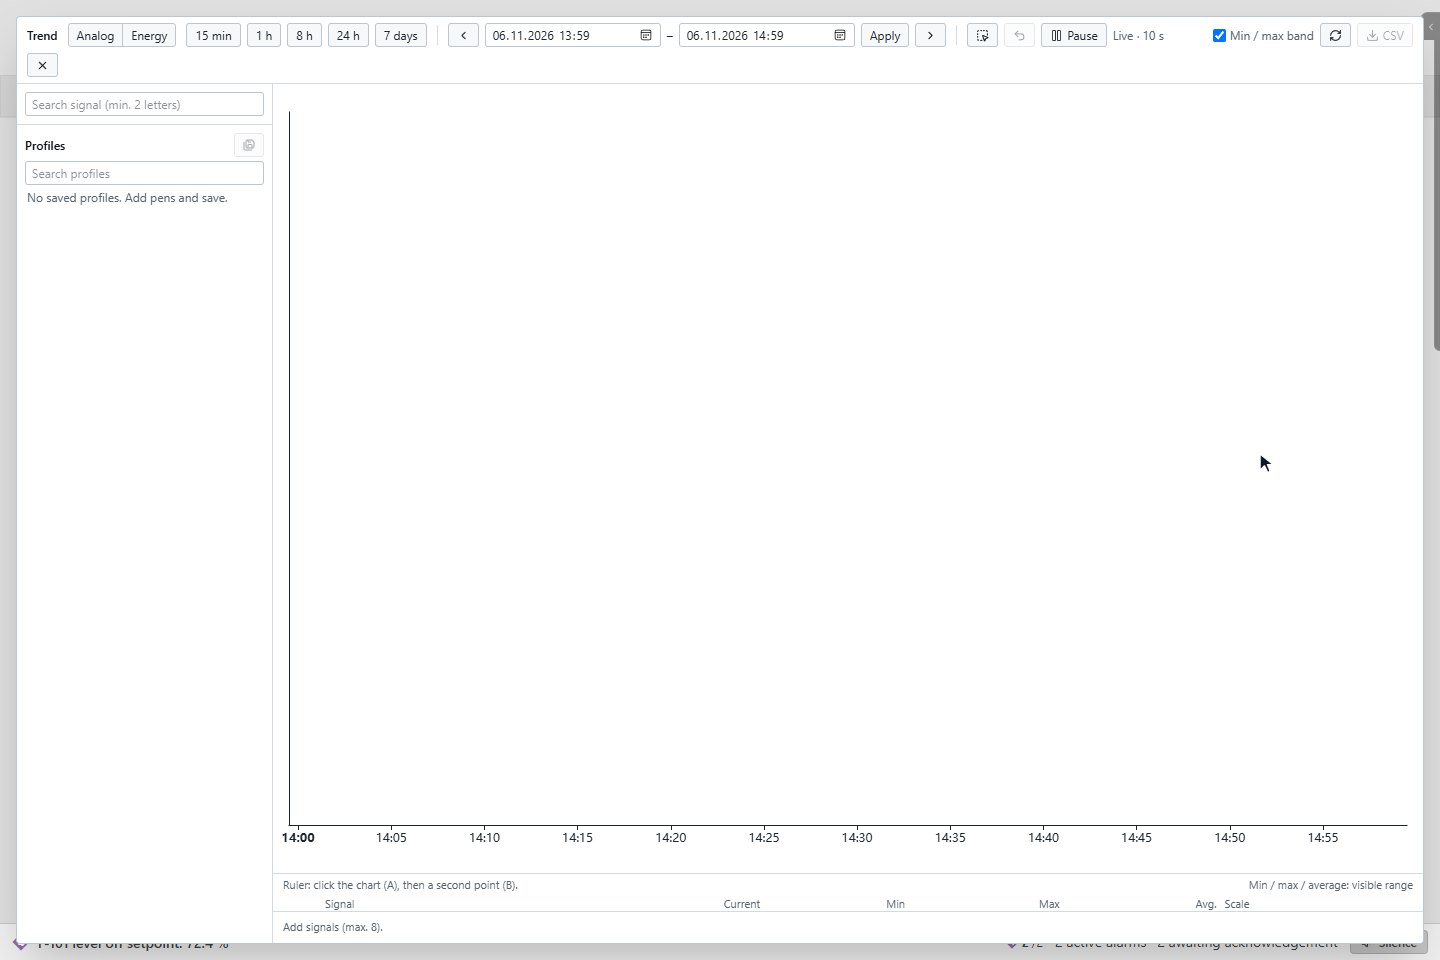
2. Add signals
Type at least two letters in Search signal (min. 2 letters). Click a result to add it. To add several at once, tick their boxes and click Add selected.
A trend holds up to eight signals. Each unit gets its own axis, alternately on the left and the right. A binary signal is drawn as steps.
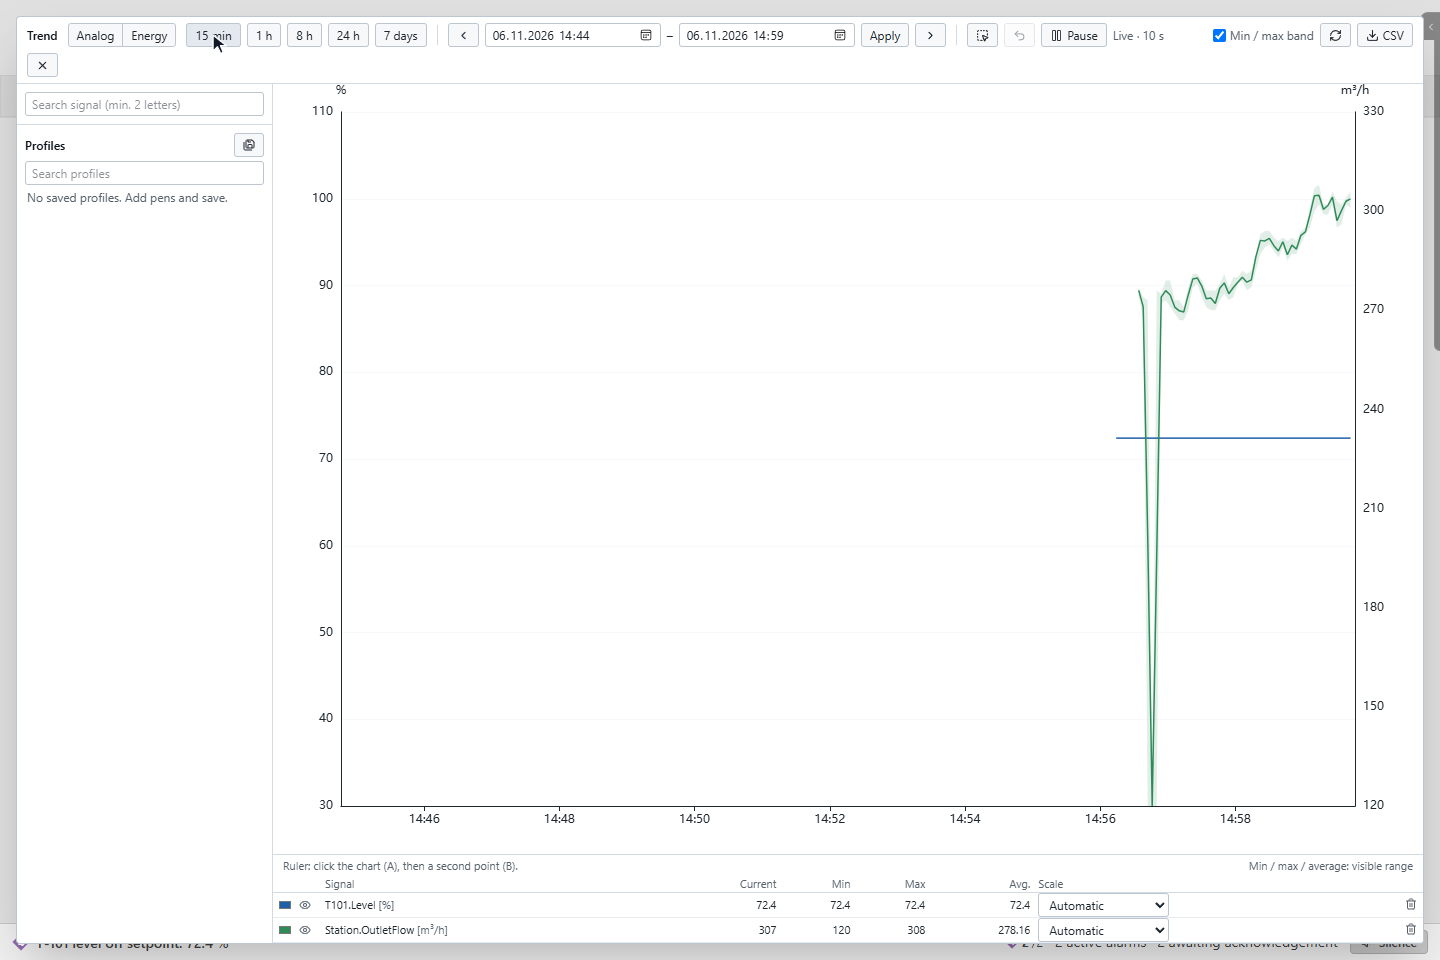
Moving the mouse over the chart shows the values of all signals at that moment.
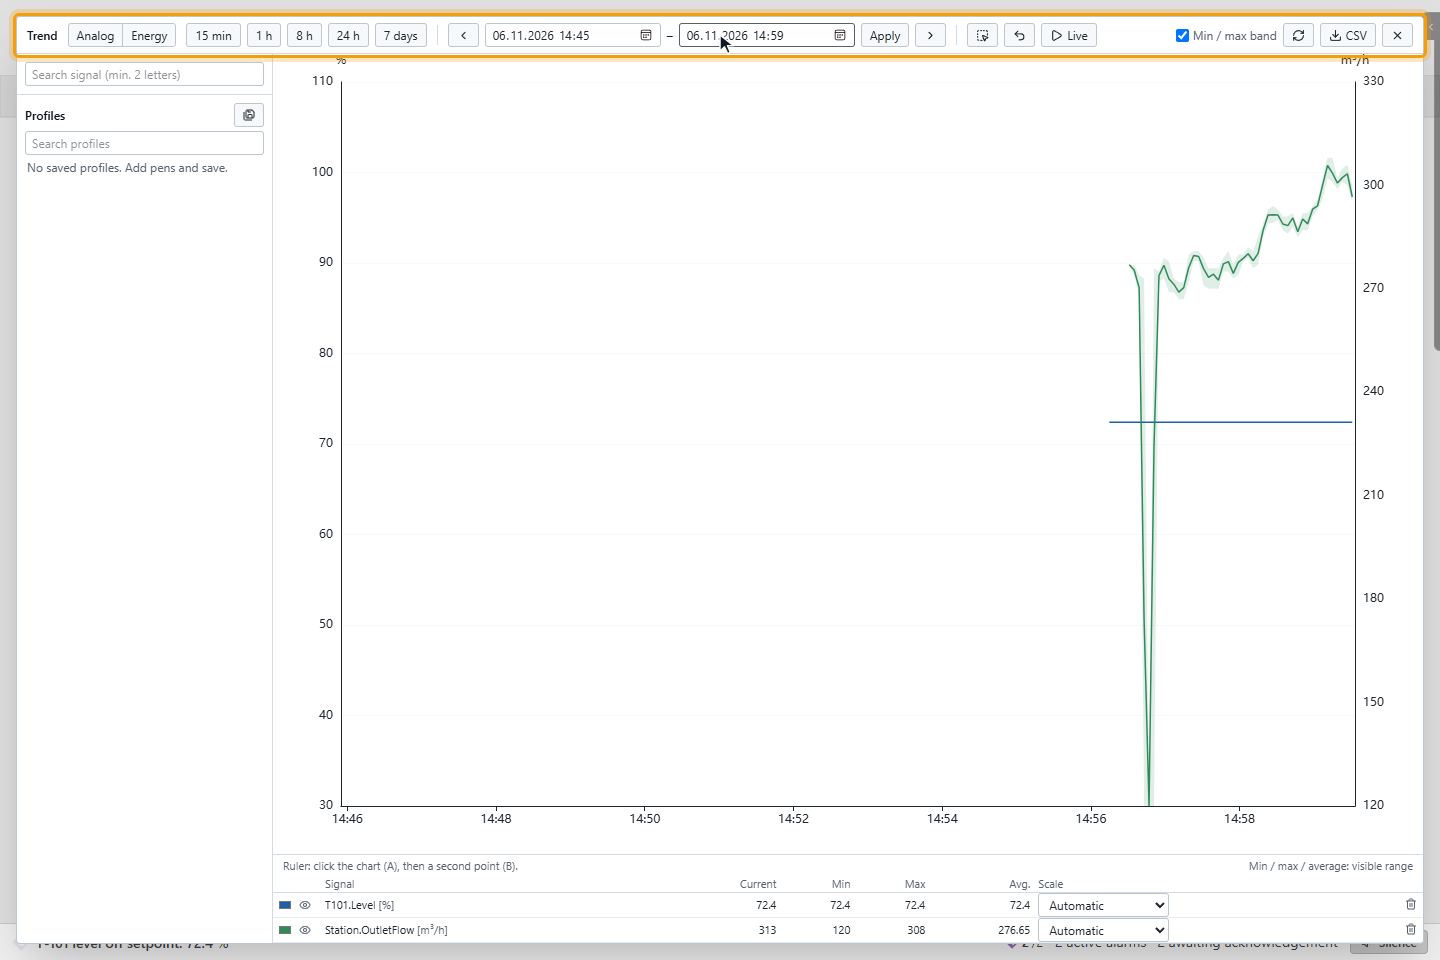
3. Choose the time range and move in it
| To | Do this |
|---|---|
| Follow a live range | Click 15 min, 1 h, 8 h, 24 h or 7 days. The trend refreshes every 10 seconds; the toolbar shows Live · 10 s. |
| Freeze the live range | Click Pause. Live goes back to now and follows it again. |
| Show a fixed range | Set Start and End and click Apply, or use the back and forward arrows. |
| Zoom in or out | Turn the mouse wheel over the chart. |
| Zoom into an area | Click the area button, then drag over the chart. |
| Move in time | Drag the chart left or right. |
| Undo a zoom | Click Undo zoom or press Backspace. |
After each zoom or move, the trend reads the visible range again. A narrower range shows finer detail.
4. Read the chart
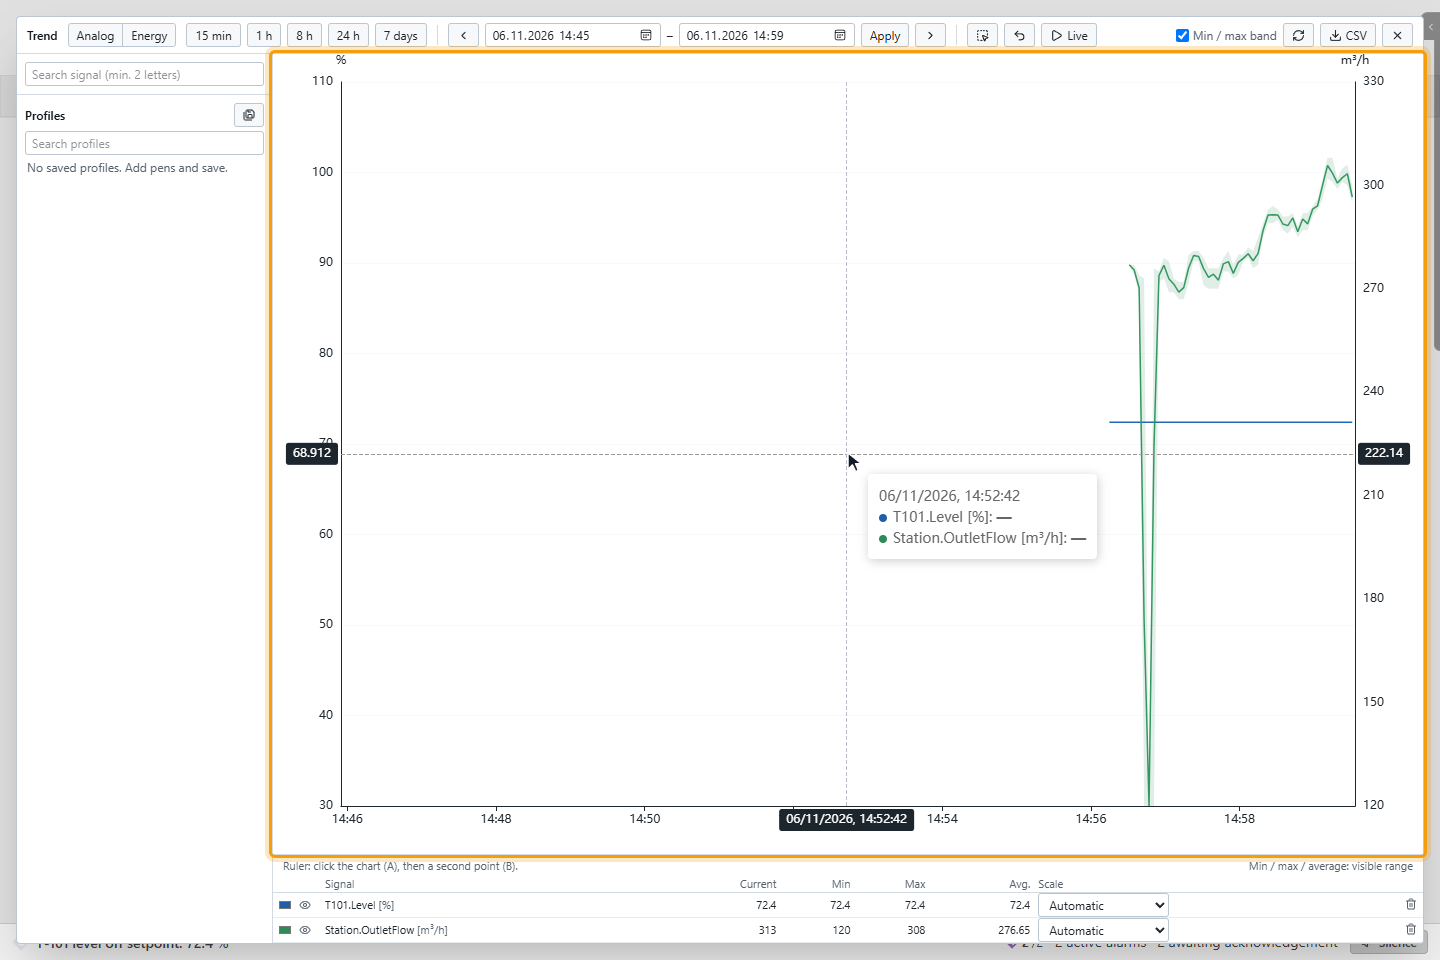
| On the chart | Meaning |
|---|---|
| Shaded band around a line | Min / max band: the lowest and highest value in each interval. It shows short spikes that the average hides. Turn it off with the Min / max band switch. |
| ▲ | A value of uncertain quality. |
| ◆ | A value of bad quality. |
| Grey band | Archive unavailable: the history could not be read for this time. |
| Gap in a line | No value was recorded in this interval, for example while the device did not communicate. |
| Dotted horizontal line | An alarm limit of the signal, with its label. The Alarm limits switch is shown only when a signal in the trend has limits. |
5. Use the pen table
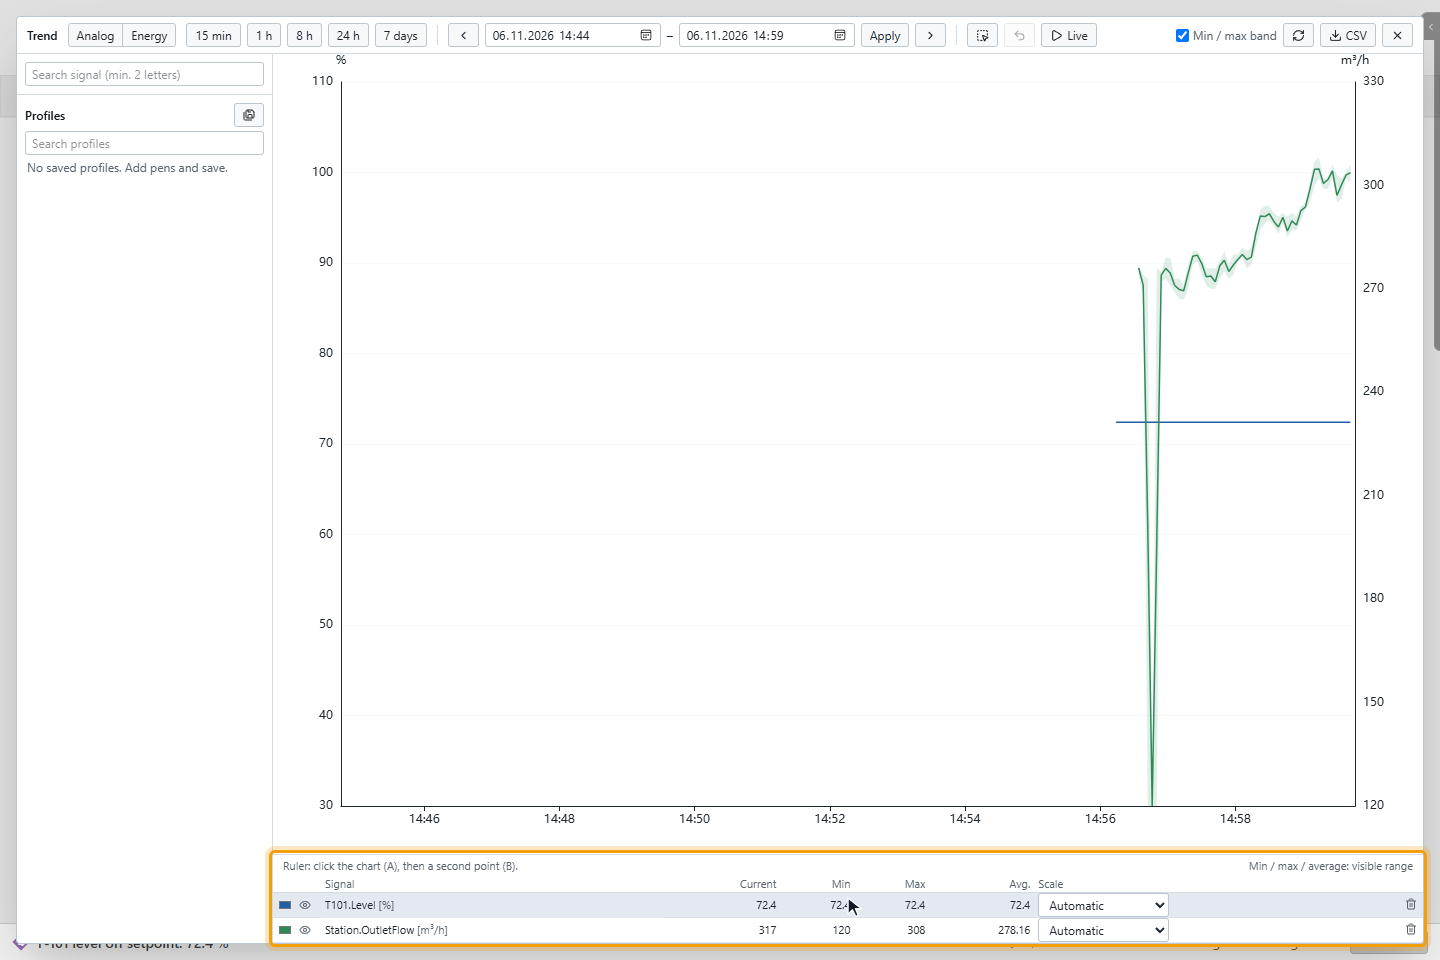
The table under the chart has one row, a pen, for each signal:
| Column | Content |
|---|---|
| Color square and eye | The color square changes the color of the line. The eye (Show / Hide) shows or hides the line without removing the signal. |
| Current | The live value. |
| Min, Max, Avg. | Of the visible range; when a ruler is placed, of the interval between A and B. |
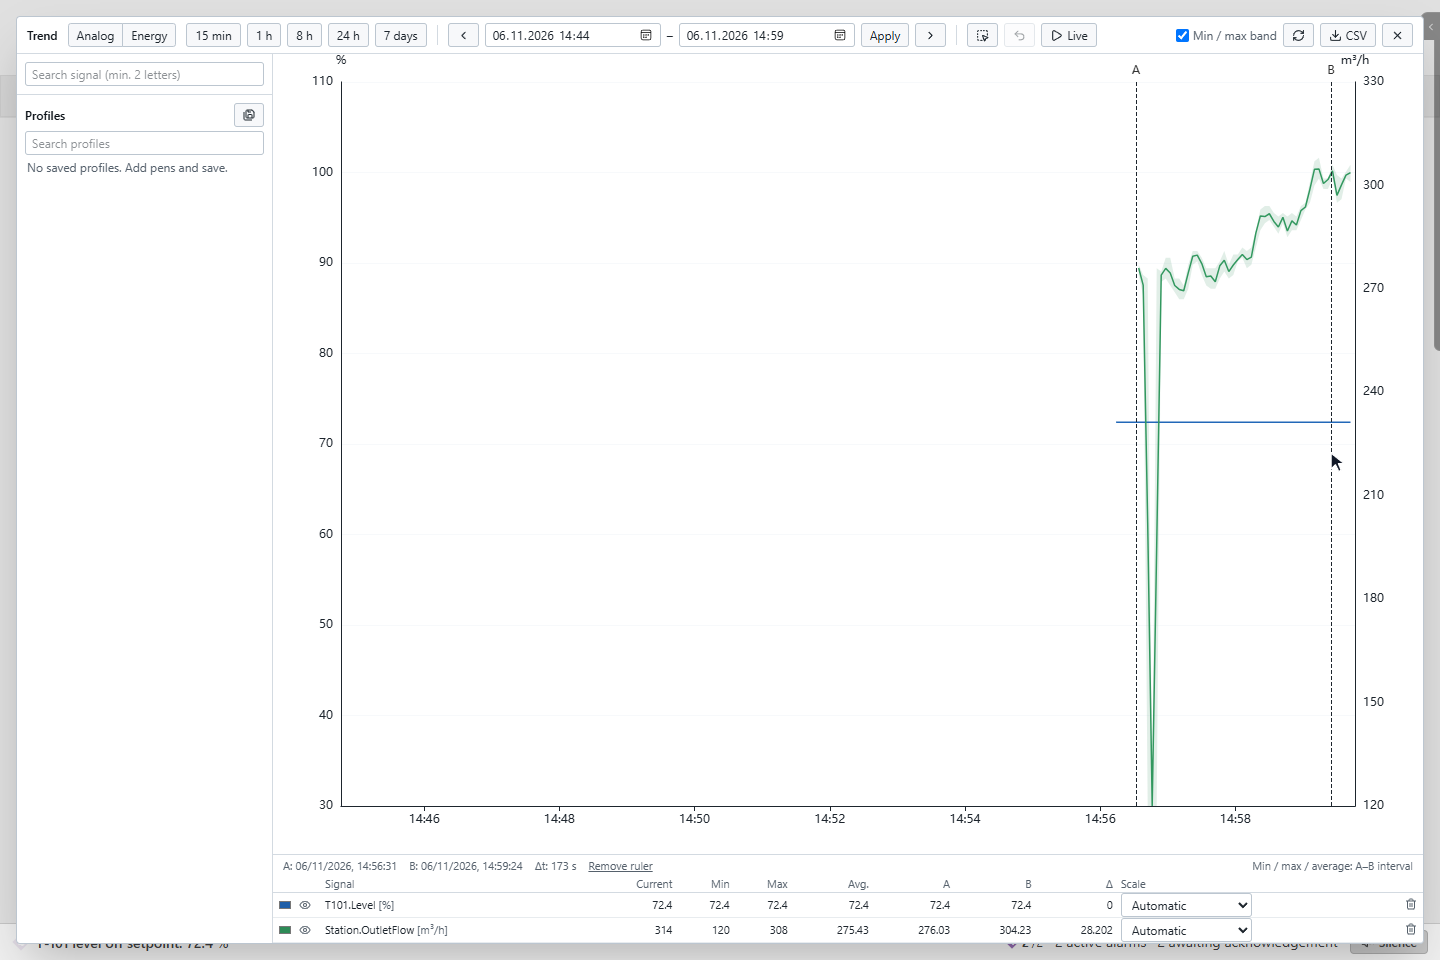
| A, B, Δ | Shown while a ruler is placed: the values at the ruler points and their difference. |
| Scale | Automatic (from the data), Engineering range (the range set for the signal; not available when the signal has none) or Manual… (your own minimum and maximum). Pens with the same unit share the scale. |
The trash icon of a row removes the signal from the trend.
6. Measure with the ruler
Click the chart for point A, then a second point for B. Above the pen table the trend shows both times and Δt in seconds; the table shows the value of each signal at A and B, the difference Δ, and the minimum, maximum and average between the two points. A third click starts a new measurement; Remove ruler removes it.
7. Save the trend as a profile
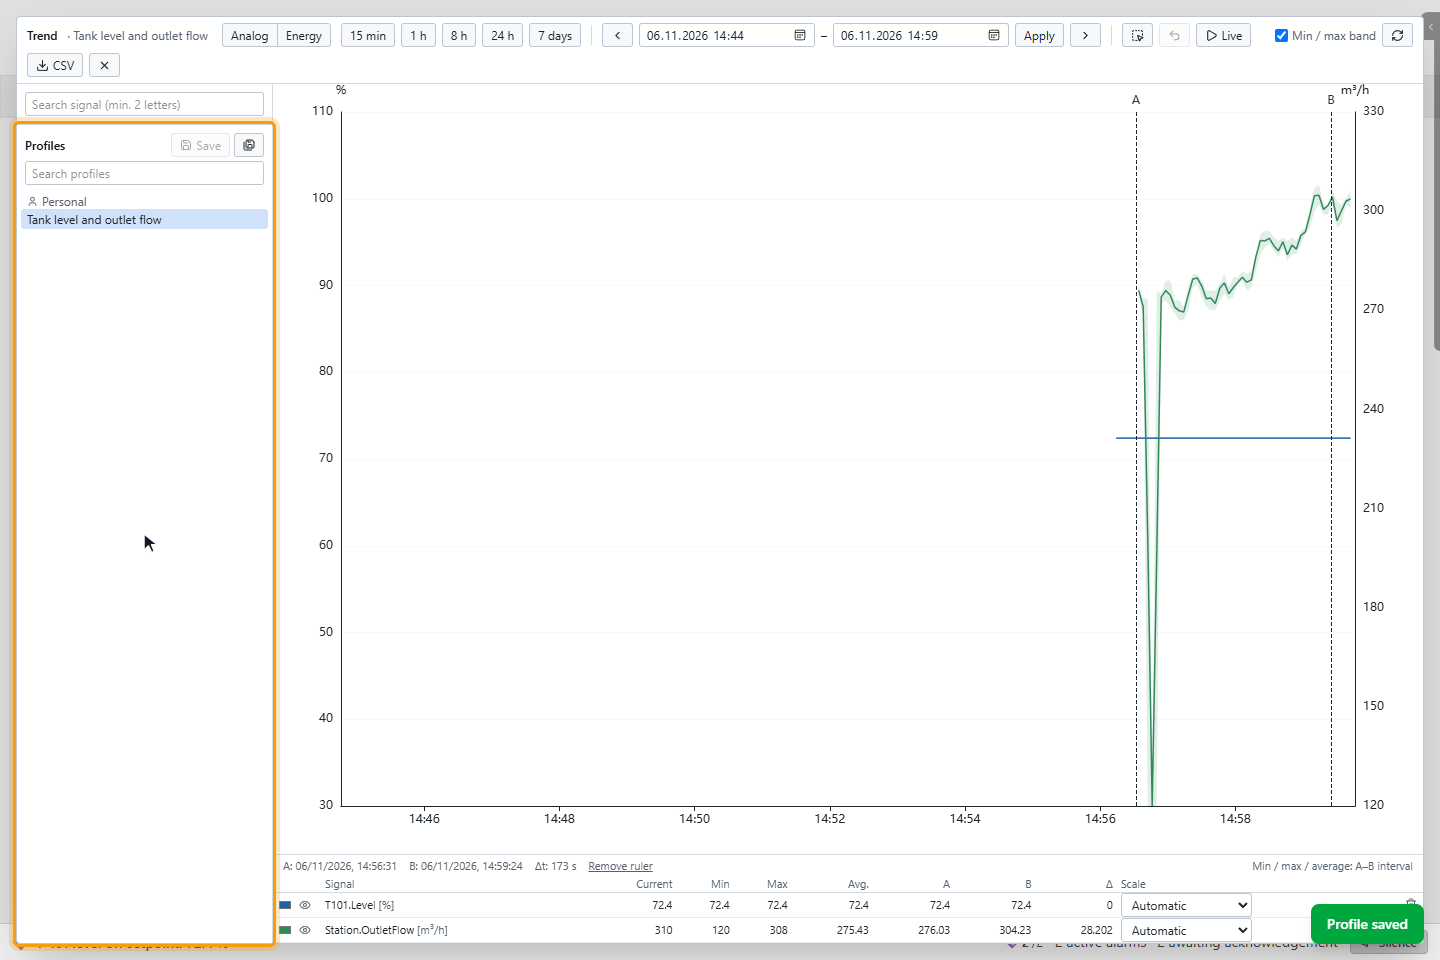
A profile saves the signals, their colors and scales, the time range, the view and the energy settings. The Profiles list on the left opens a profile with one click.
- To save a new profile, click Save as new profile, type a Profile name and choose Personal or Shared, then click Save.
- After you change an open profile, click Save.
- To rename or delete a profile, move the mouse over it and click the pencil or the trash icon.
| Profile | Who sees it | Who can change it |
|---|---|---|
| Personal | Only you | You |
| Shared | Everyone in the project | Users with the Editor access permission |
In a project without user login, all profiles are shared. A signal that no longer exists stays in the profile with !.
8. Show the energy per period
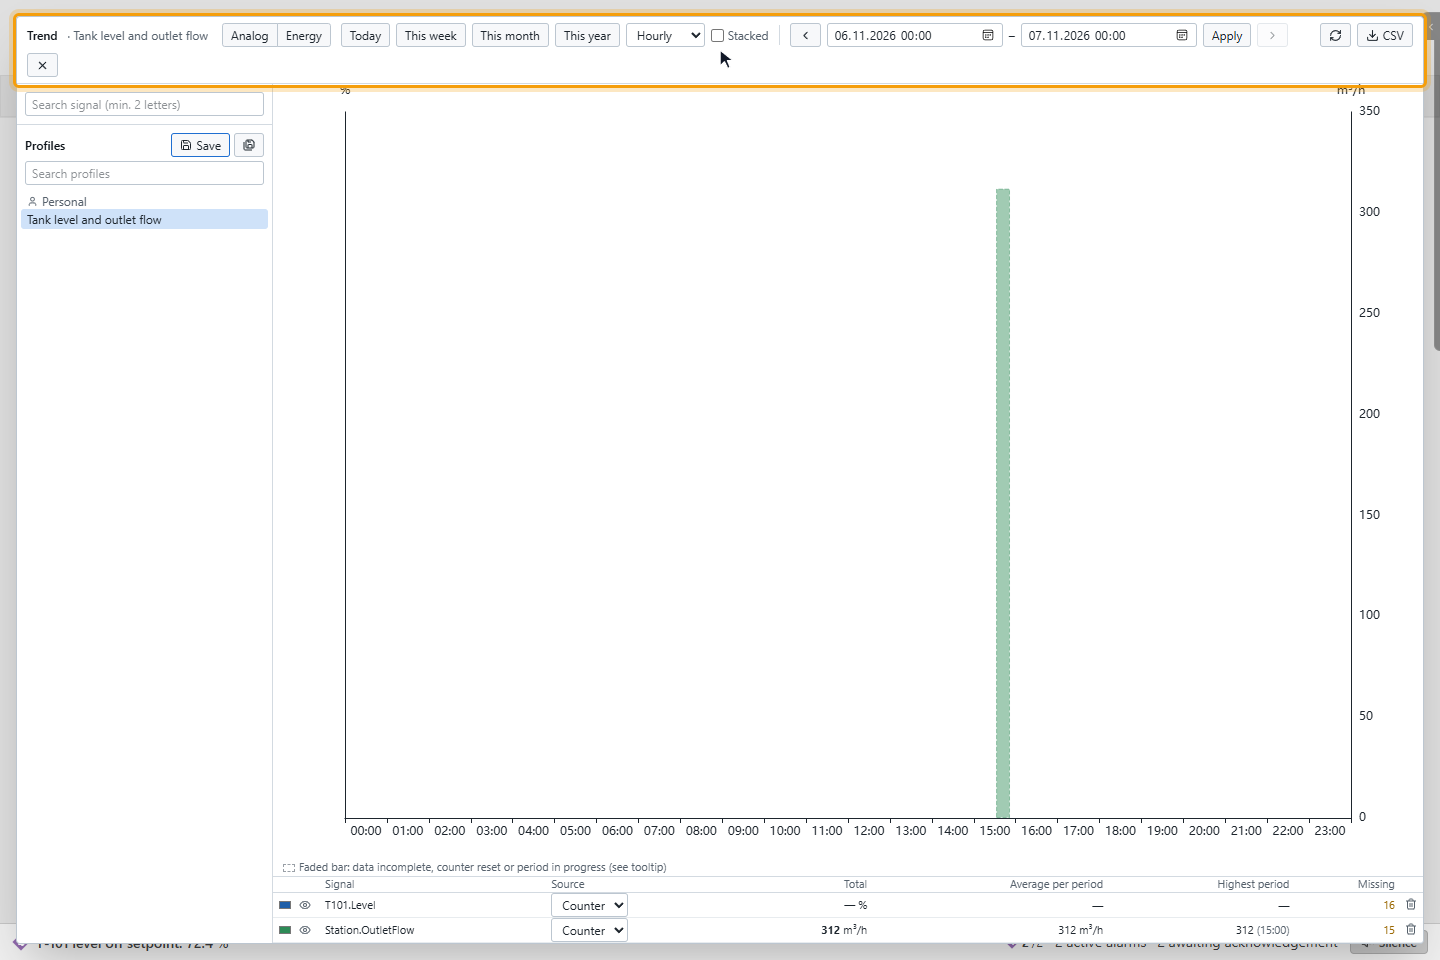
Click Energy next to Analog. Each bar is the energy of one period:
- Today, This week, This month or This year chooses the range. The back arrow goes to the previous one; Start, End and Apply set any range.
- The period list next to them chooses Hourly, Daily or Monthly.
- Stacked stacks the pens with the same unit, for a total production or consumption.
The Source of each pen is chosen from its unit, and you can change it:
| Source | For | Energy of a period |
|---|---|---|
| Counter | A cumulative meter, unit ending in Wh, VAh or varh | End of the period minus end of the previous period |
| Power | Instantaneous power, unit ending in W, VA or var | Average power × duration |
A faded, dashed bar means that the data is incomplete, the counter was reset or the period is still running; the tooltip of the bar says which. The table under the chart shows the Total, the Average per period, the Highest period and the Missing periods.
9. Export as CSV
Click CSV. The file contains the visible range: the time in UTC and, for each signal, the average, minimum and maximum of each interval; see Export data. In the energy view, the file has the period, the value and its state for each pen.
Good to know
- The trend shows averages over intervals. Zooming in reads finer intervals.
- The trend closes with Close or Esc. Signals you do not save in a profile are not kept for the next time.
- To choose the signals by clicking objects on the screen, or to draw an XY chart, use Draw charts from the screen.