A tour of the runtime screen
The runtime screen has few controls, so that the plant gets the space. This page shows where they are.
Before you begin
- You are signed in. See Open the runtime screen and sign in.
Steps
1. Look at the screen
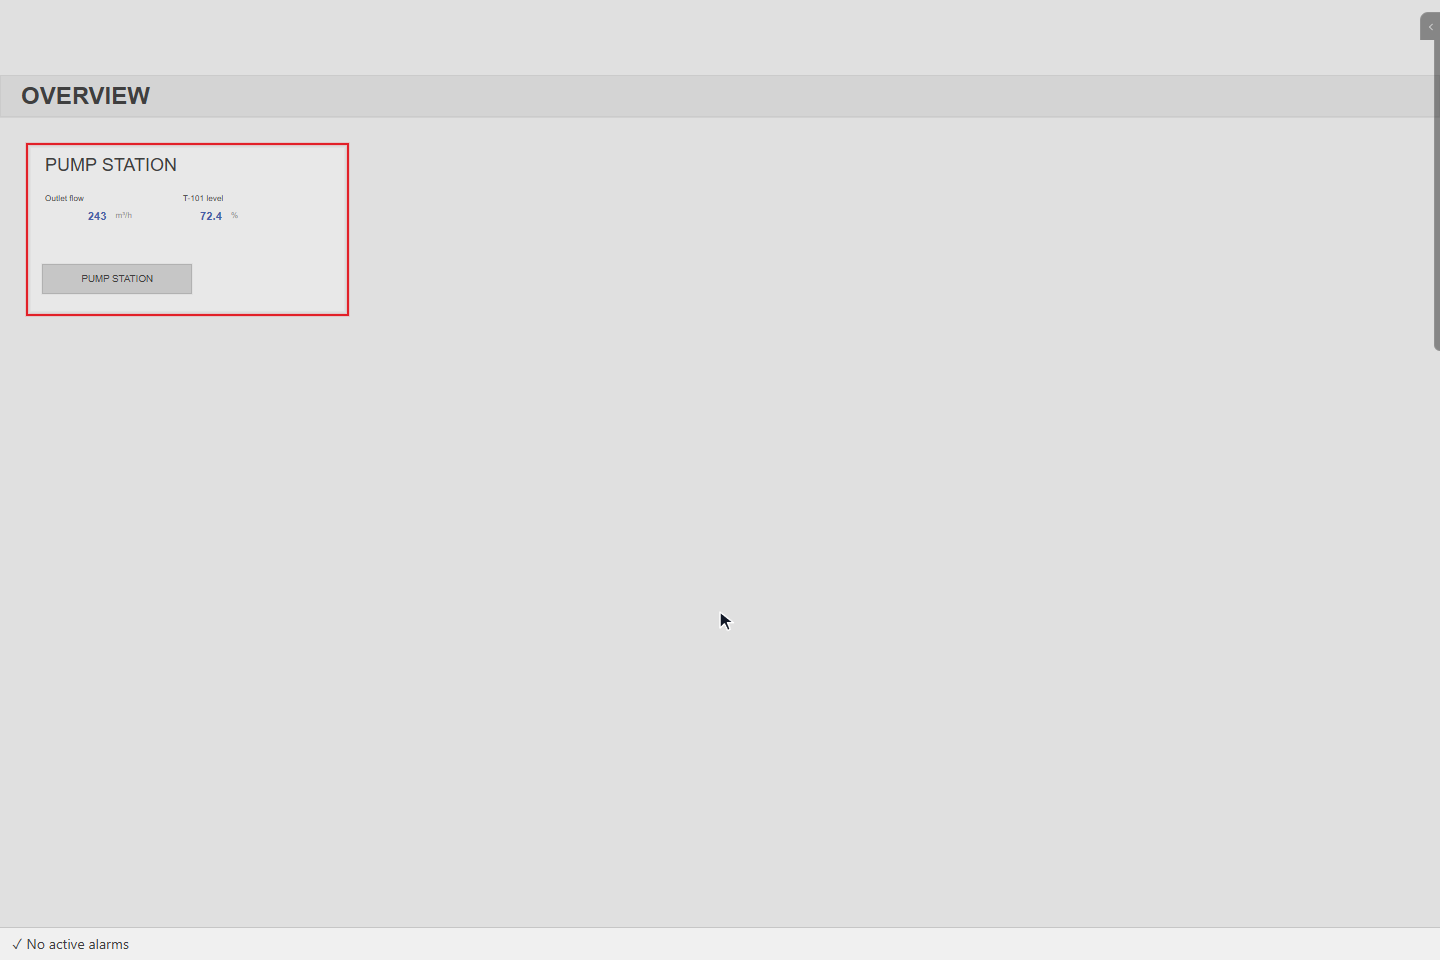
The page of the plant fills the screen. Here it is OVERVIEW: the pump station with its outlet flow and tank level, and a PUMP STATION button that opens the detail page. The alarm bar runs along the bottom.
2. Open the control rail
Move the mouse to the right edge of the screen. A grey handle shows where the rail is; the rail slides out and hides again when you move away. From top to bottom:
| Button | Use |
|---|---|
| Fullscreen (F11) | Shows the screen without the browser bars. Press again to leave. |
| Settings | Opens the settings (step 3). |
| Screenshot (PNG / PDF) | Saves a picture of the screen. Shortcut Ctrl+P. |
| Person button | The session menu: sign out, switch user, theme, blinking. |
| Zoom in, Zoom out, 1:1, Fit to page, Fill screen | Change the size of the page. See Move between screens and adjust the view. |
| Hand | Reminds you that Space + drag moves the page. |
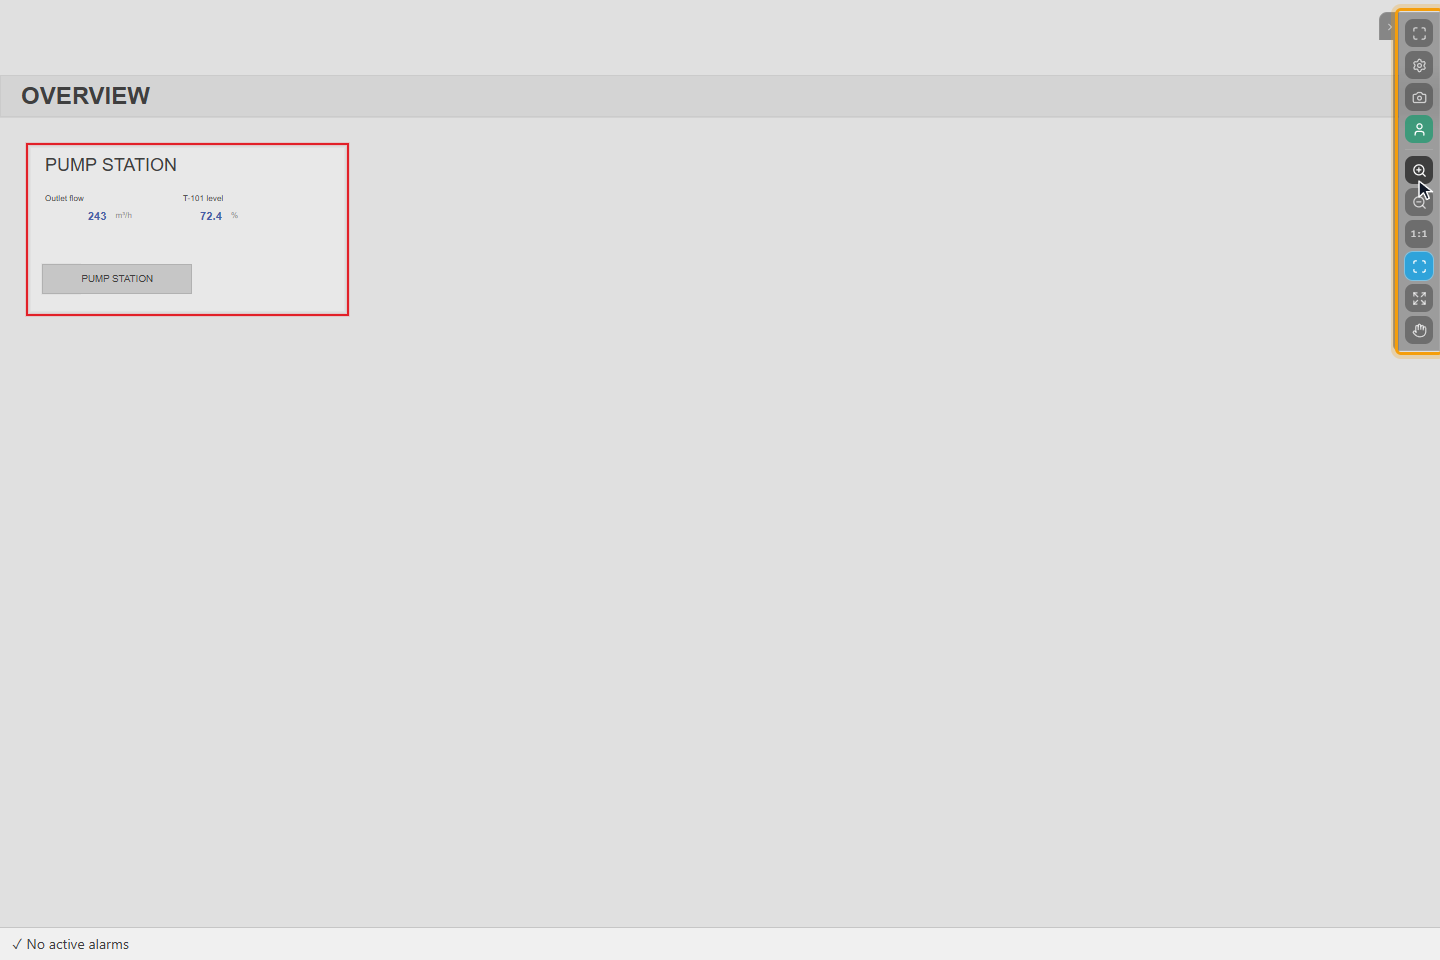
To move the rail up or down, for example off a button of the page, drag the handle. YTCC keeps the position for your user in this project (in a project without sign-in, in this browser). Double-click the handle to put the rail back at its default position.
When an object has lost communication, a dot appears on the handle, pink while the last known values are shown, and one more button appears on the rail. It switches between showing the last known position and hiding it; its tooltip names the current view, Showing last known values or Position hidden while communication is lost.
3. Open the settings
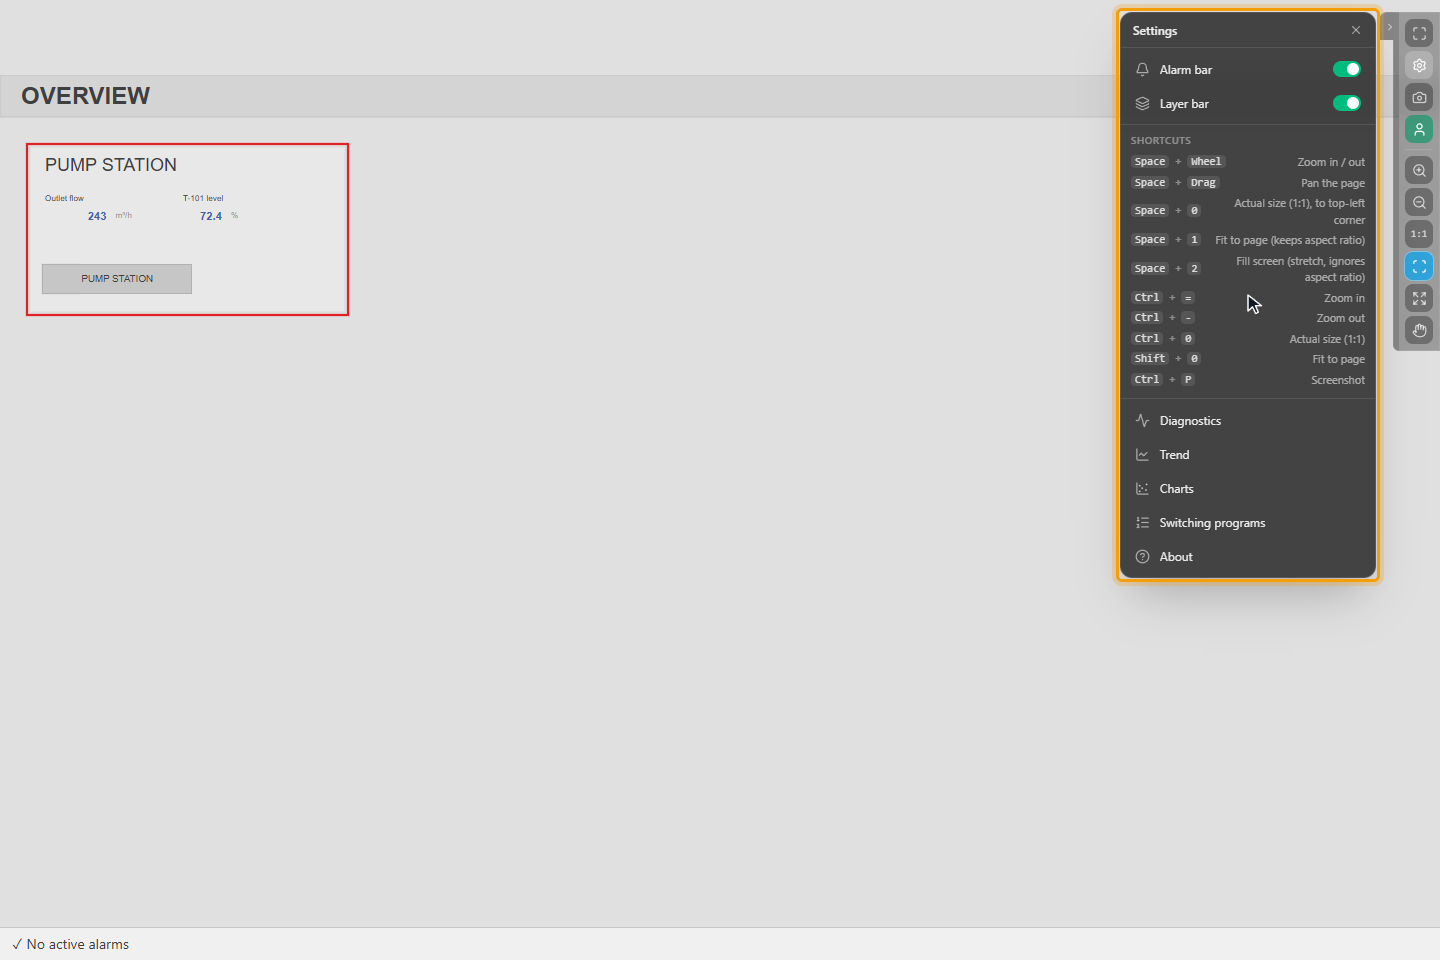
Click Settings. The settings show:
- Alarm bar and Layer bar: show or hide the alarm bar at the bottom and the layer buttons. These are shared by everyone who uses the project, so only users who may edit the project can change them.
- Shortcuts: the keys for zooming, moving the page and taking a screenshot.
- Diagnostics: the state of the project's services. Trend: draw signals over time. Charts: draw the signals of objects you click; see Draw charts from the screen. Switching programs: run prepared switching sequences, if your project uses them. About: the version information of YTCC.
Click Settings again to close them.
4. Read the alarm bar
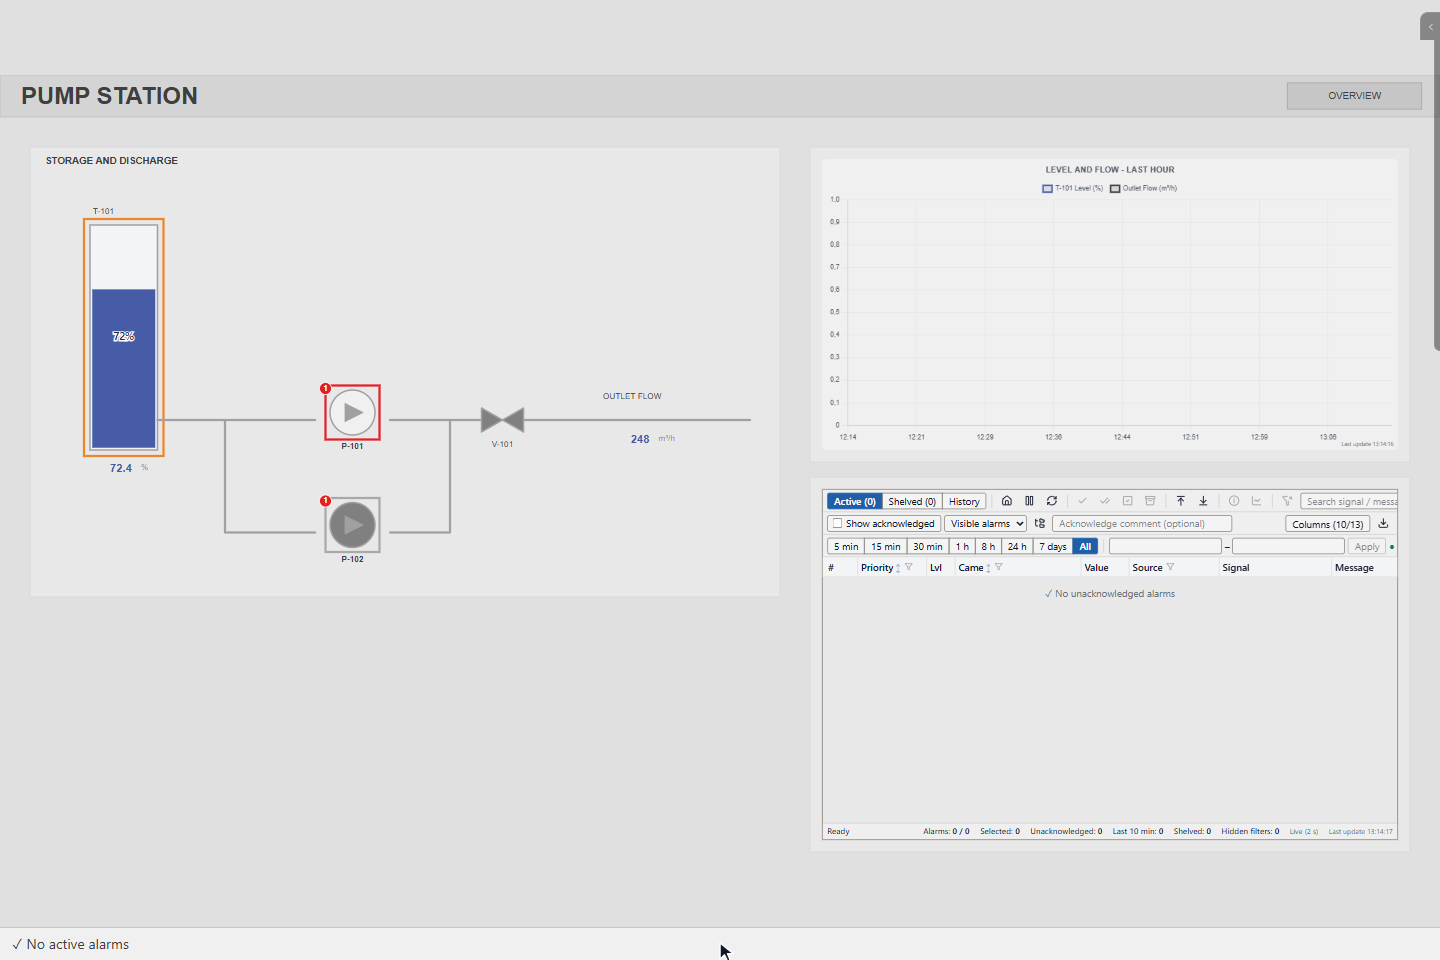
The bar at the bottom shows the alarm situation at a glance:
- the most urgent alarm that waits for acknowledgement, with its priority symbol;
- one counter per priority, as awaiting acknowledgement / total;
- the total, for example 8 active alarms · 7 awaiting acknowledgement, or ✓ No active alarms;
- Silence while the horn sounds. It stops the sound only; the alarms still wait for acknowledgement.
Click the bar to go to the page with the alarm list.
If the server cannot be reached, the bar says Alarm service unreachable.
Result
You know where the controls of the runtime screen are.
When the connection is lost
If the connection to the server is lost, a banner appears at the top of the screen and the values stop changing. The banner says that there is no server connection, that the data is not up to date with the time of the last update, and that the screen is reconnecting. When the connection is back, it says that the data is being refreshed, and then disappears.
The banner reads, for example, No server connection — data is not up to date (last update 14:32:05). Reconnecting… and, when the connection is back, Connected — refreshing data….
Do not operate the plant from values while the banner is shown. Inform your project engineer if it does not go away.