Draw charts from the screen
With Charts you click objects on the screen, and YTCC draws their signals in a window. You can compare several signals in a curve, draw one against another in an XY chart, and save the open windows as a template.
Before you begin
- The project runs and you are signed in. The signals are recorded in the history.
Steps
1. Open the signal selection
Move the mouse to the top right corner of the screen to show the control rail, click Settings and then Charts. A button the designer set up with the action Chart Signal Selection does the same. The Charts bar opens at the bottom of the screen with Signal selection on.
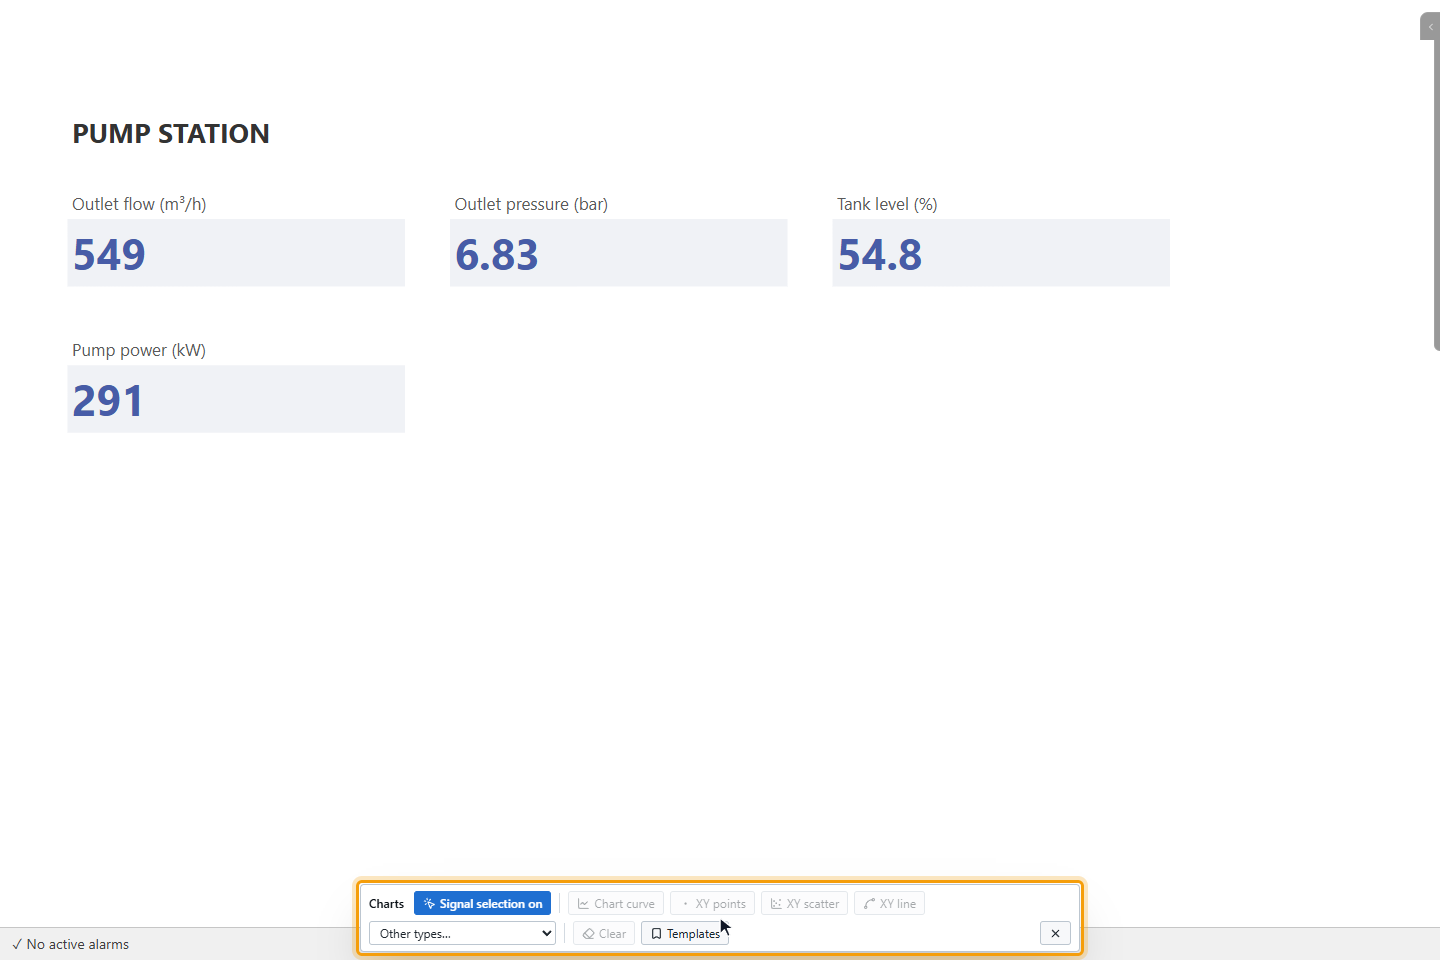
While the selection is on, a click on an object runs no action and no command. Esc ends the selection.
2. Click the objects
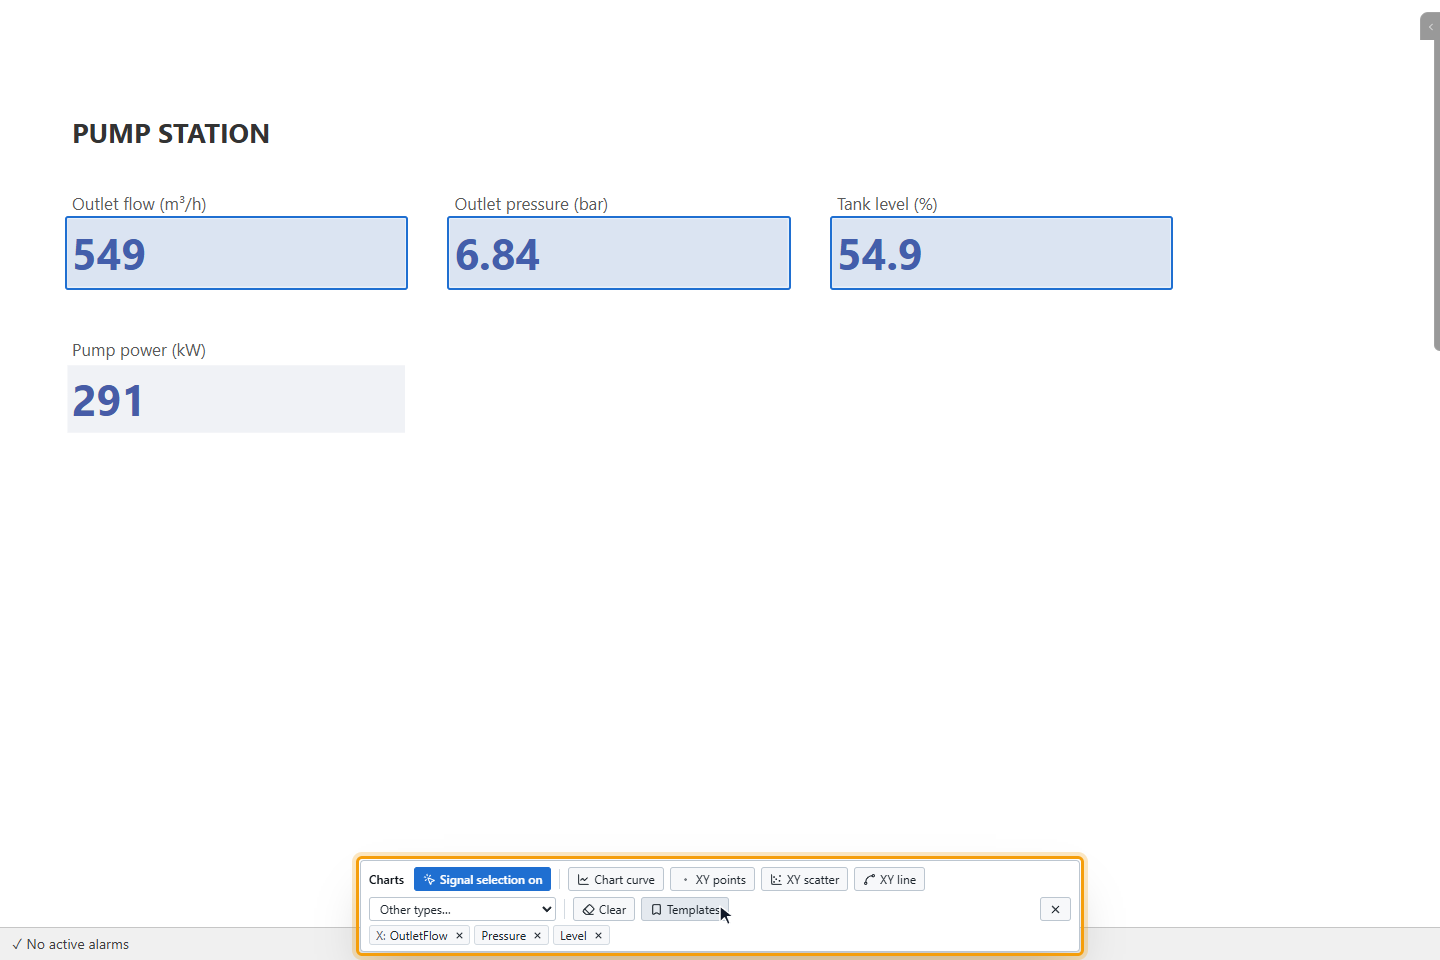
Click an object bound to a signal. A frame marks the object, and its signals appear in the bar. A second click removes them, and the × of a signal removes that one. Clear removes all. An object without a signal shows This object is not bound to a signal.
To choose signals on another page, click the button again so that it shows Selection paused, change the page and click it once more.
3. Draw a curve
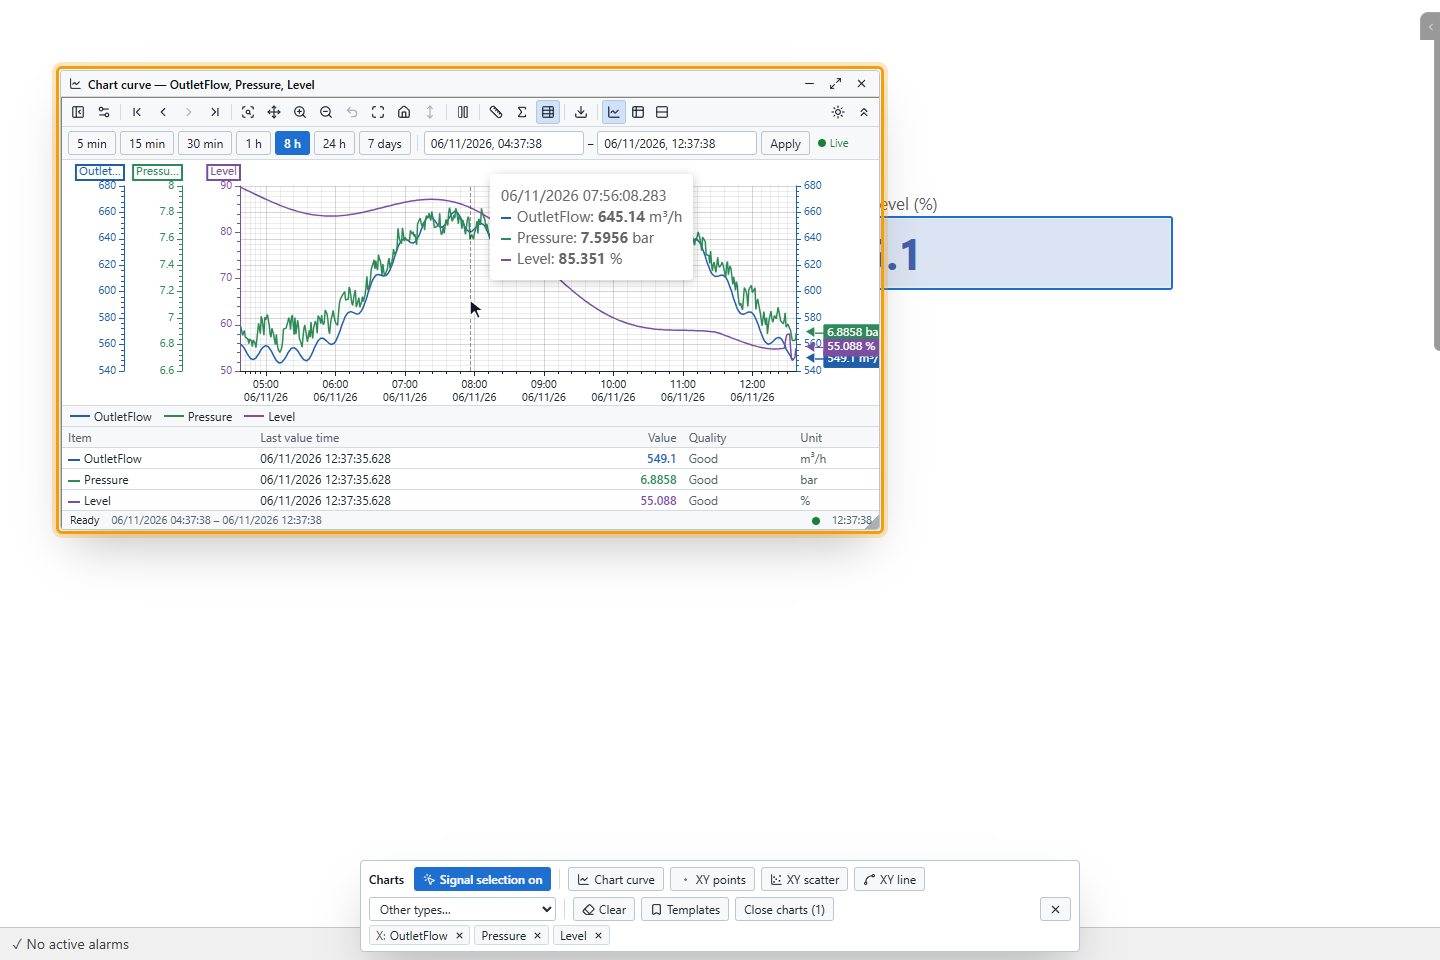
Click Chart curve. A window opens with the selected signals over the last 60 minutes; the image shows it after 8 h. It has the same toolbar, date-time bar and value table as the Trend object. Each click on a type opens a new window.
4. Draw an XY chart
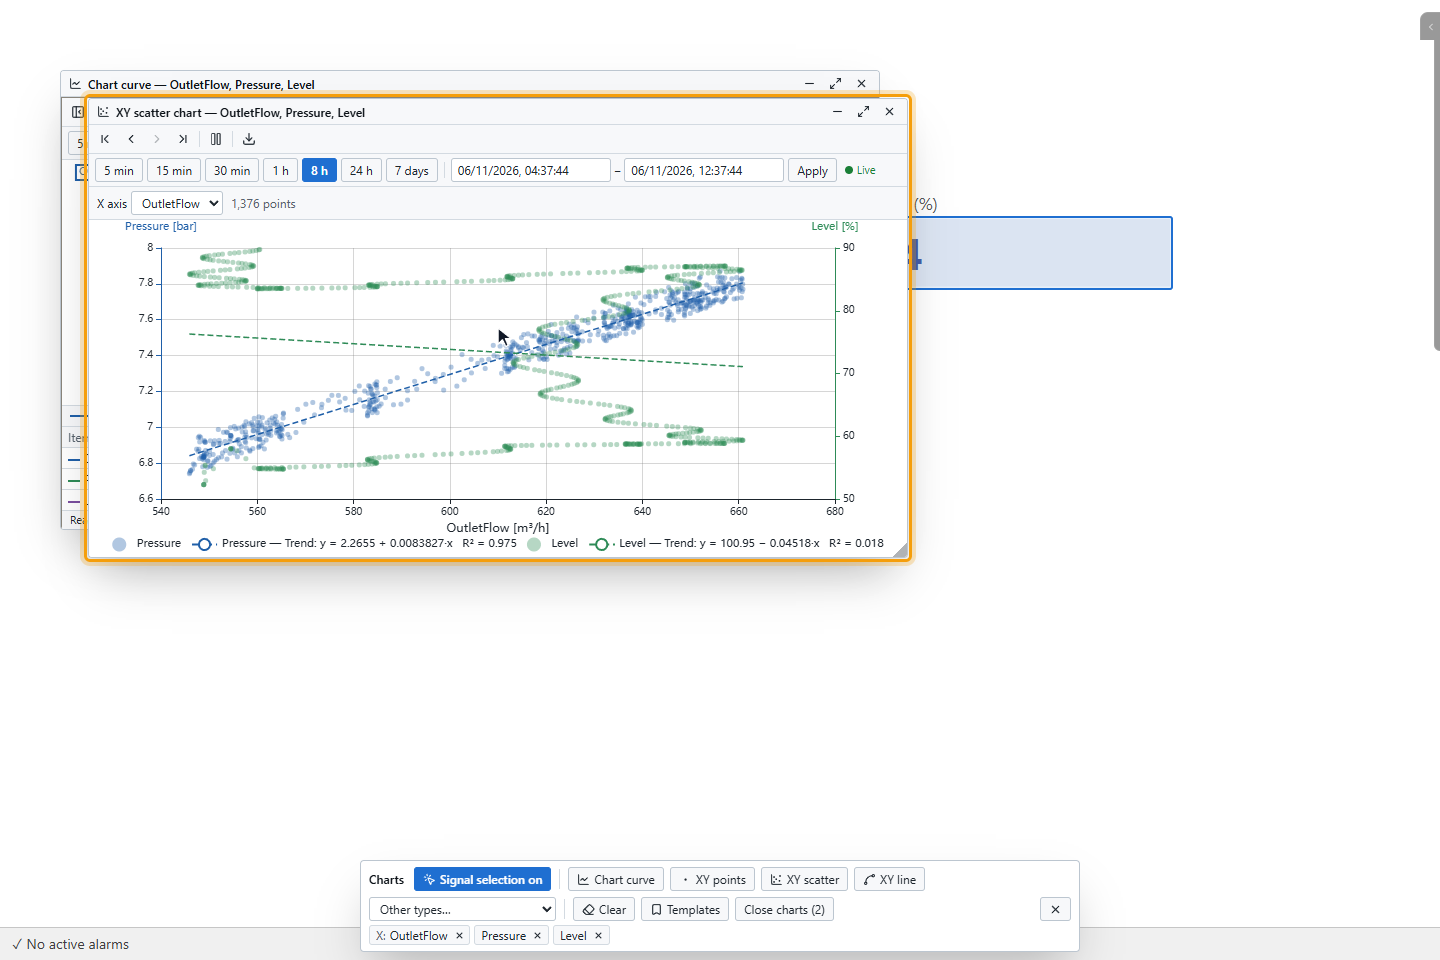
XY charts need at least two signals. The first one you clicked is the X axis (X: in the bar); the X axis list in the window changes it. YTCC pairs the values by time and shows the number of point(s).
| Button | Shows |
|---|---|
| XY points | The pairs as points |
| XY scatter | The pairs as points, with the trend line and R² |
| XY line | The pairs joined in time order |
No matching data in this range means that the signals have no values at common times in the range.
5. Choose another chart type
Other types… lists Histogram, Duration curve, State timeline, Heatmap, Time comparison (yesterday), SPC control chart and Box plot. Heatmap and Box plot start with the last 7 days, Time comparison (yesterday), Duration curve and Histogram with the last 24 hours. For what they show, see Period and analysis charts.
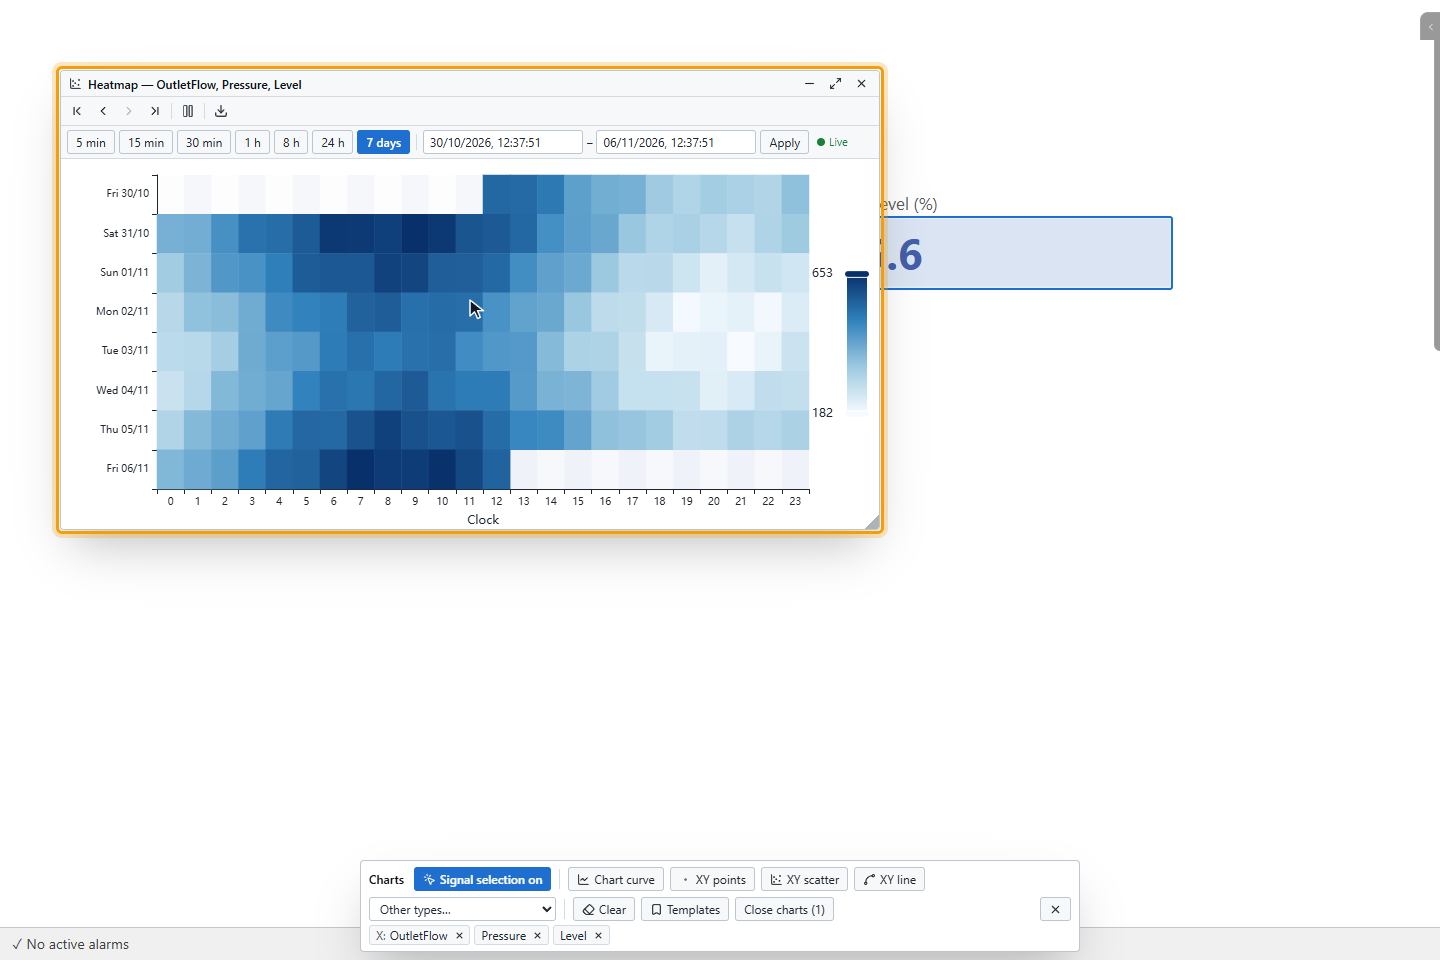
6. Arrange the windows
Drag a window by its title and resize it from the bottom right corner. Minimize leaves only the title. Maximize or a double click on the title fills the screen, and Restore returns to the previous size. Close charts in the bar closes all windows and shows how many are open. The × of the bar ends the selection and clears the signals; the windows stay open.
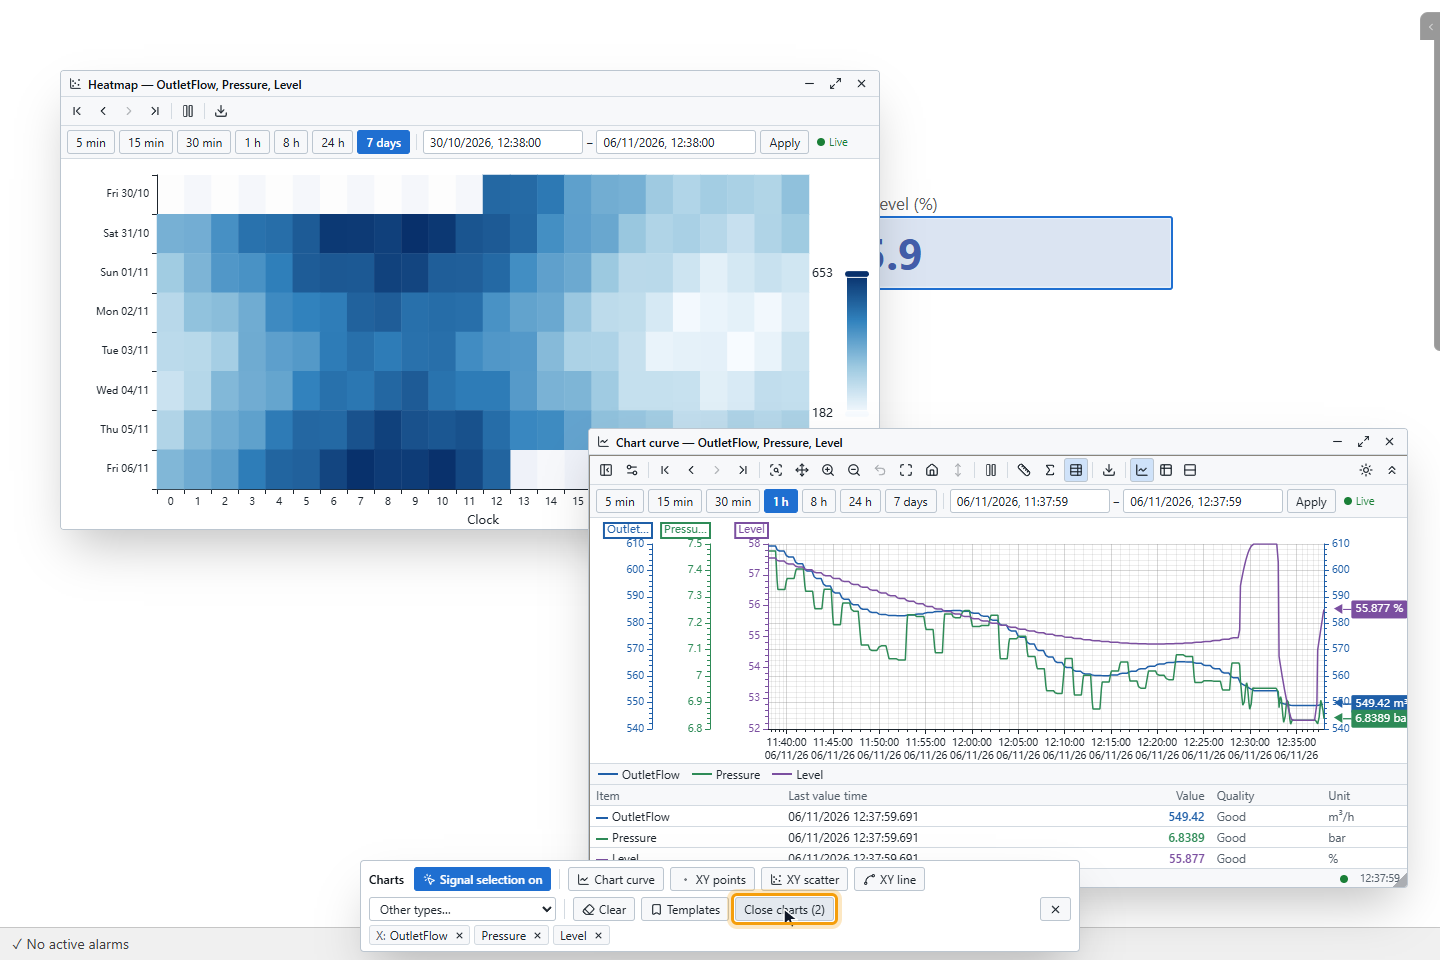
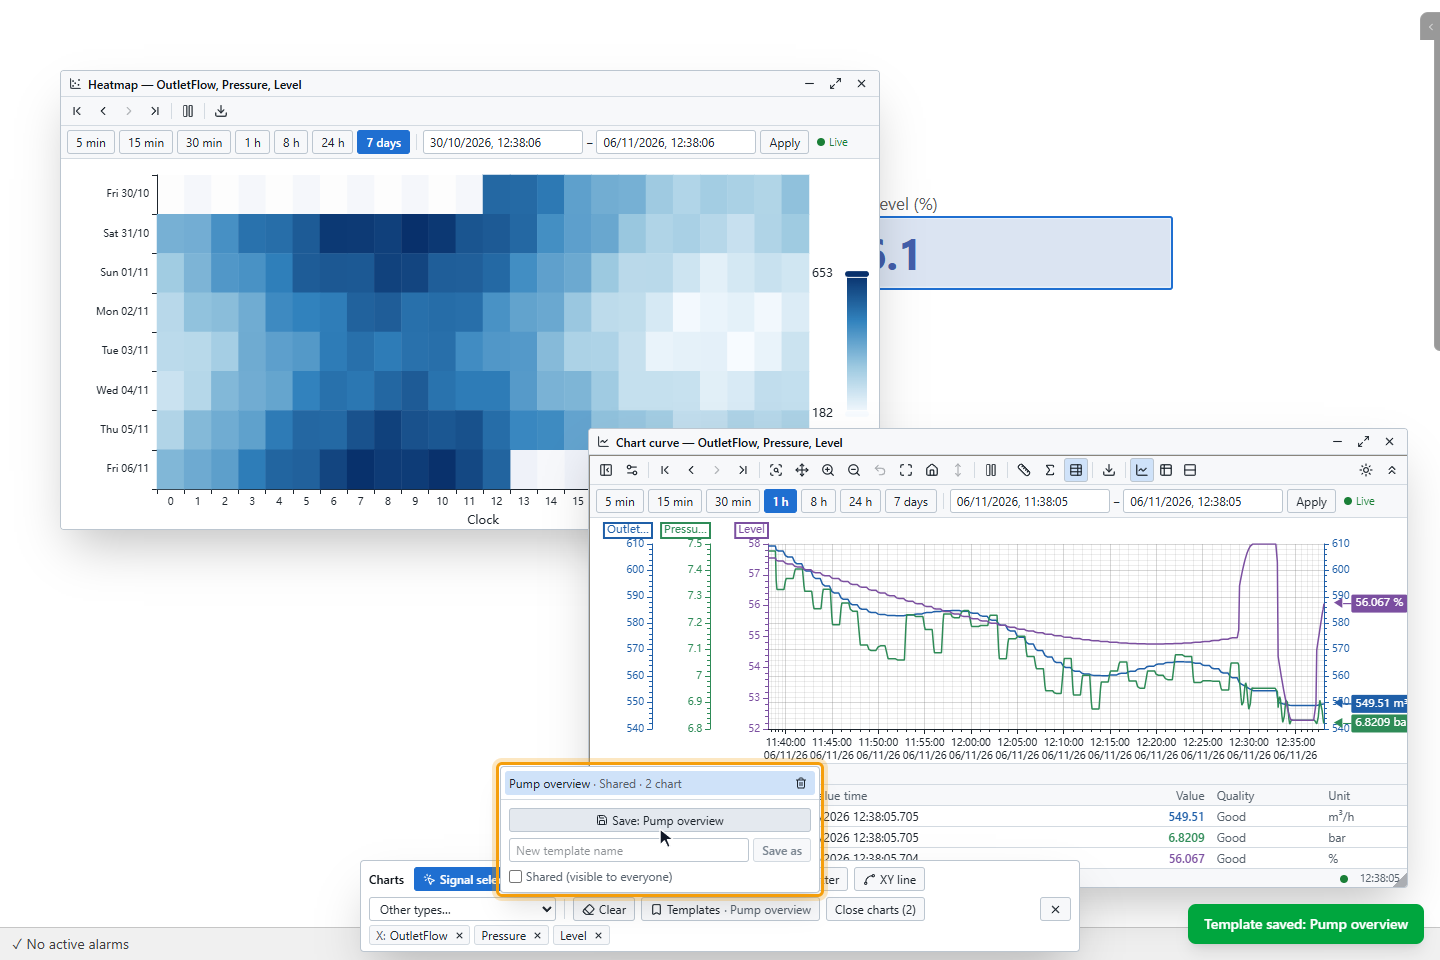
7. Save the windows as a template
Click Templates in the bar, type a New template name and click Save as. The template keeps every open window with its type, signals and time range, up to 24 windows.
Click a template in the list to open all its windows. Save with the name of an open template updates it, and the trash icon deletes it. A button with the action Open Chart Template opens a template by its name.
| Template | Who sees it | Who can change it |
|---|---|---|
| Personal | Only you | You |
| Shared (Shared (visible to everyone) ticked) | Everyone in the project | Users with the Editor access permission |
Shared (visible to everyone) is shown only to these users. In a project without user login, all templates are shared. While the licence design lock is active, a template cannot be saved.
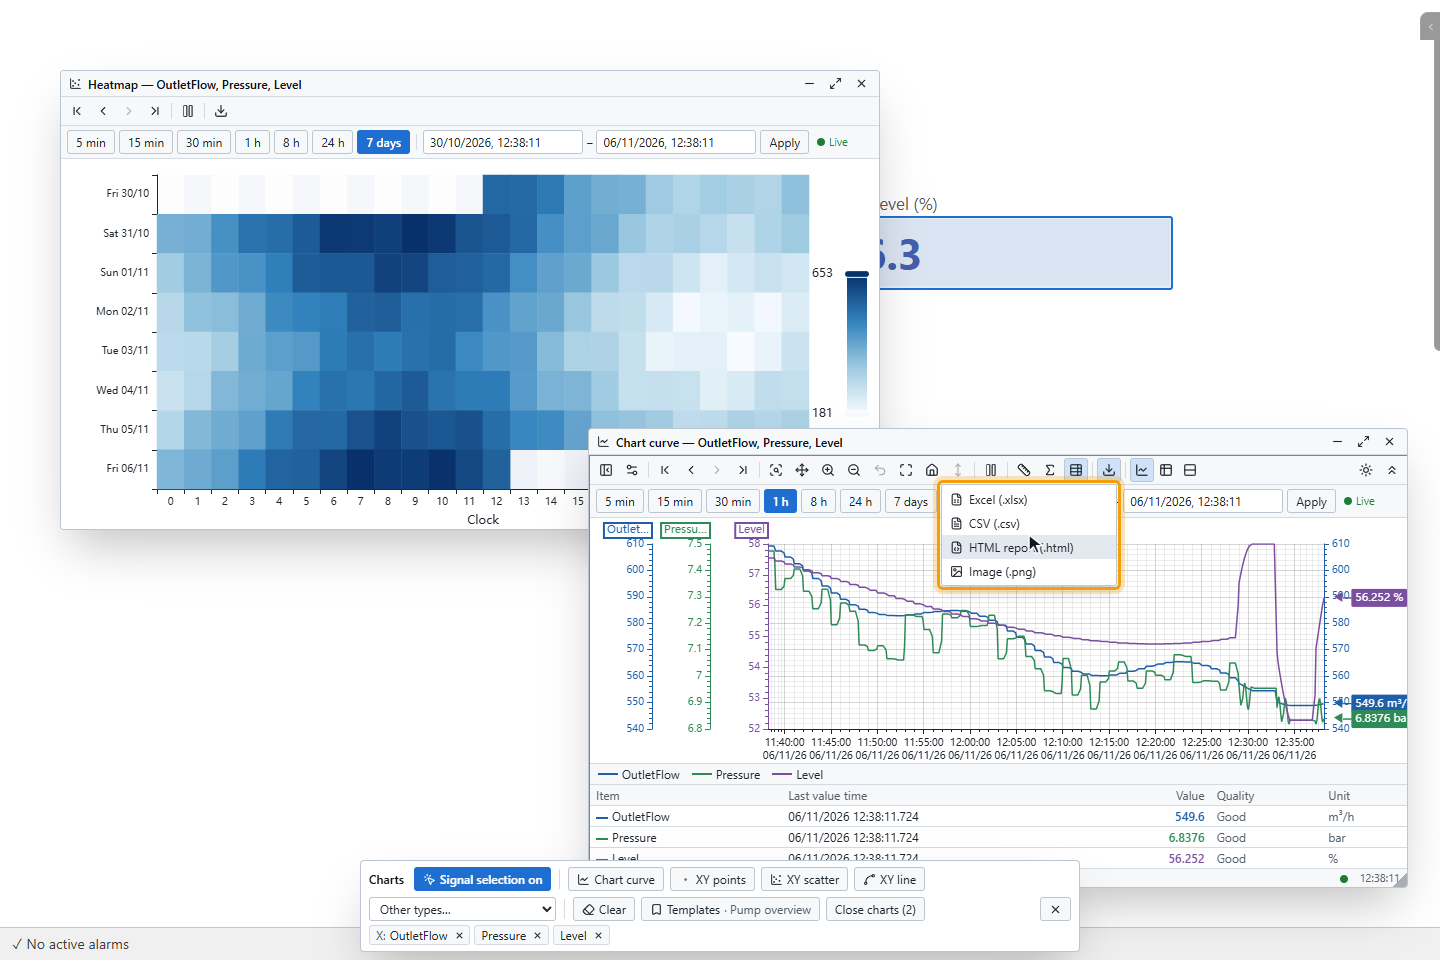
8. Export a chart
Click Export in the toolbar of a window and choose Excel (.xlsx), CSV (.csv), HTML report (.html) or Image (.png). The file holds the range of the window. YTCC asks where to save the file; a browser without this dialog downloads it and a message says so.
Good to know
- No special permission is needed to open Charts and to draw.
- The windows and the selection are not kept when the page is reloaded. Save a template to keep them.
- For a saved set of signals with an A/B ruler and energy bars, use the trend.