Search and export the alarm history
The alarm history keeps every event of every alarm: when it came, was acknowledged, went, was shelved or unshelved, and by whom. Use it to answer "what happened at 3 o'clock?" or to hand a report to your shift lead.
Before you begin
- You are signed in to the runtime screen. See Open the runtime screen and sign in.
- The page with the alarm list is open. See Read the alarm list and the alarm bar.
Steps
1. Open the history
Click History in the toolbar of the alarm list. The list shows the events of the last 24 hours, newest first, with Time, Priority, Event, Value, Message, Duration, Operator and Description (the comment typed when the alarm was acknowledged or shelved). Event: in the status bar, here 4 / 4, counts the loaded events and the events that match the filter.
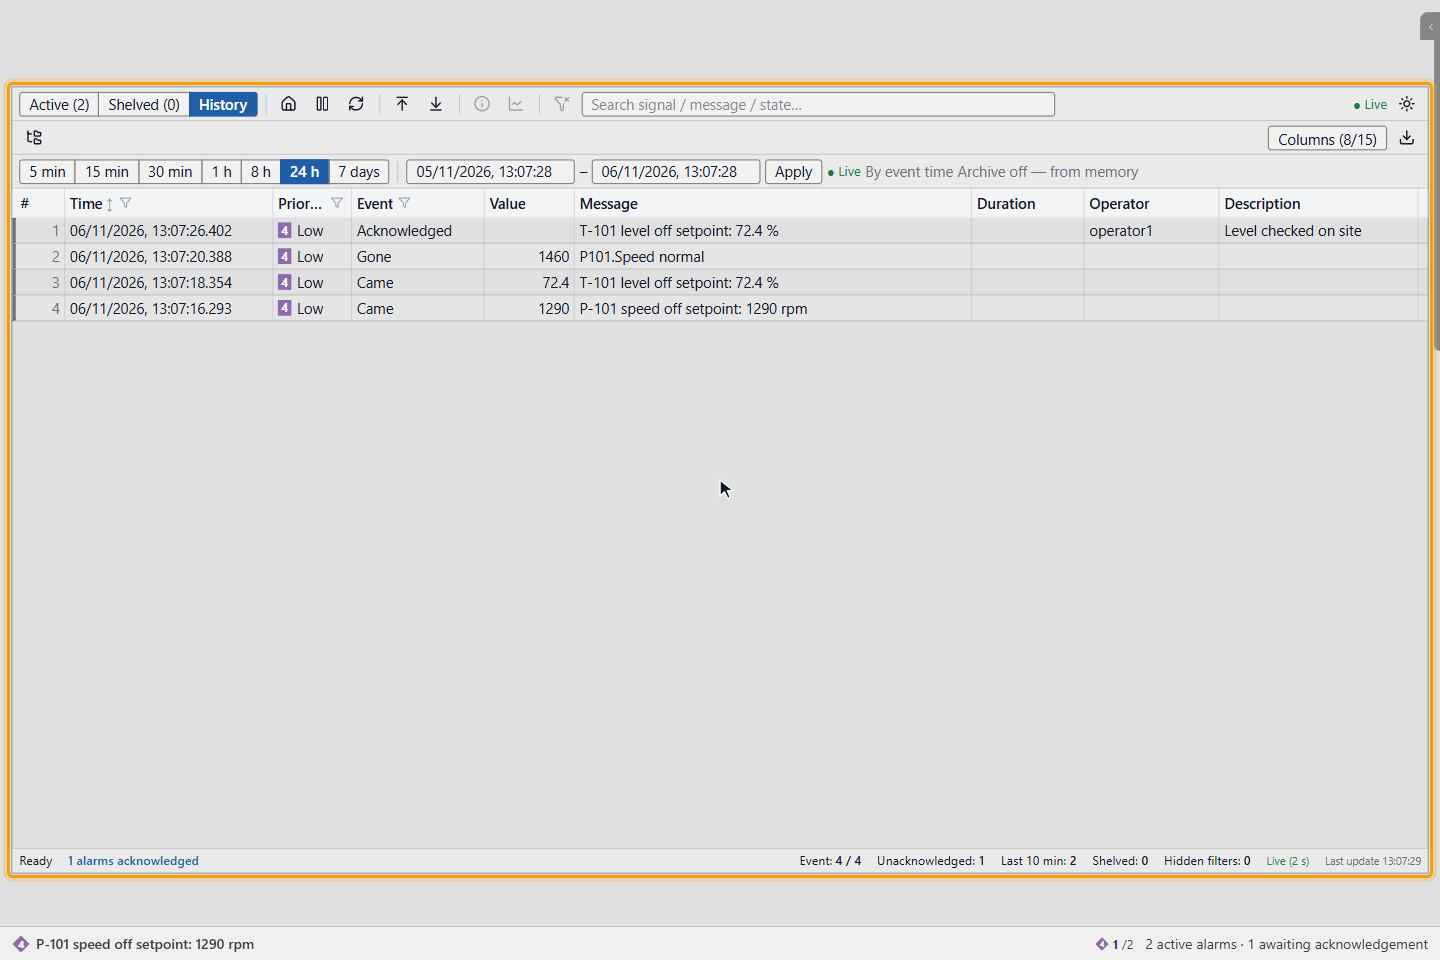
To add older events, click Load more at the end of the list. If Archive off — from memory or Archive unreachable — from memory appears, the long-term archive is off or cannot be read, and the list shows only the recent events that the alarm service keeps in memory.
2. Filter the history
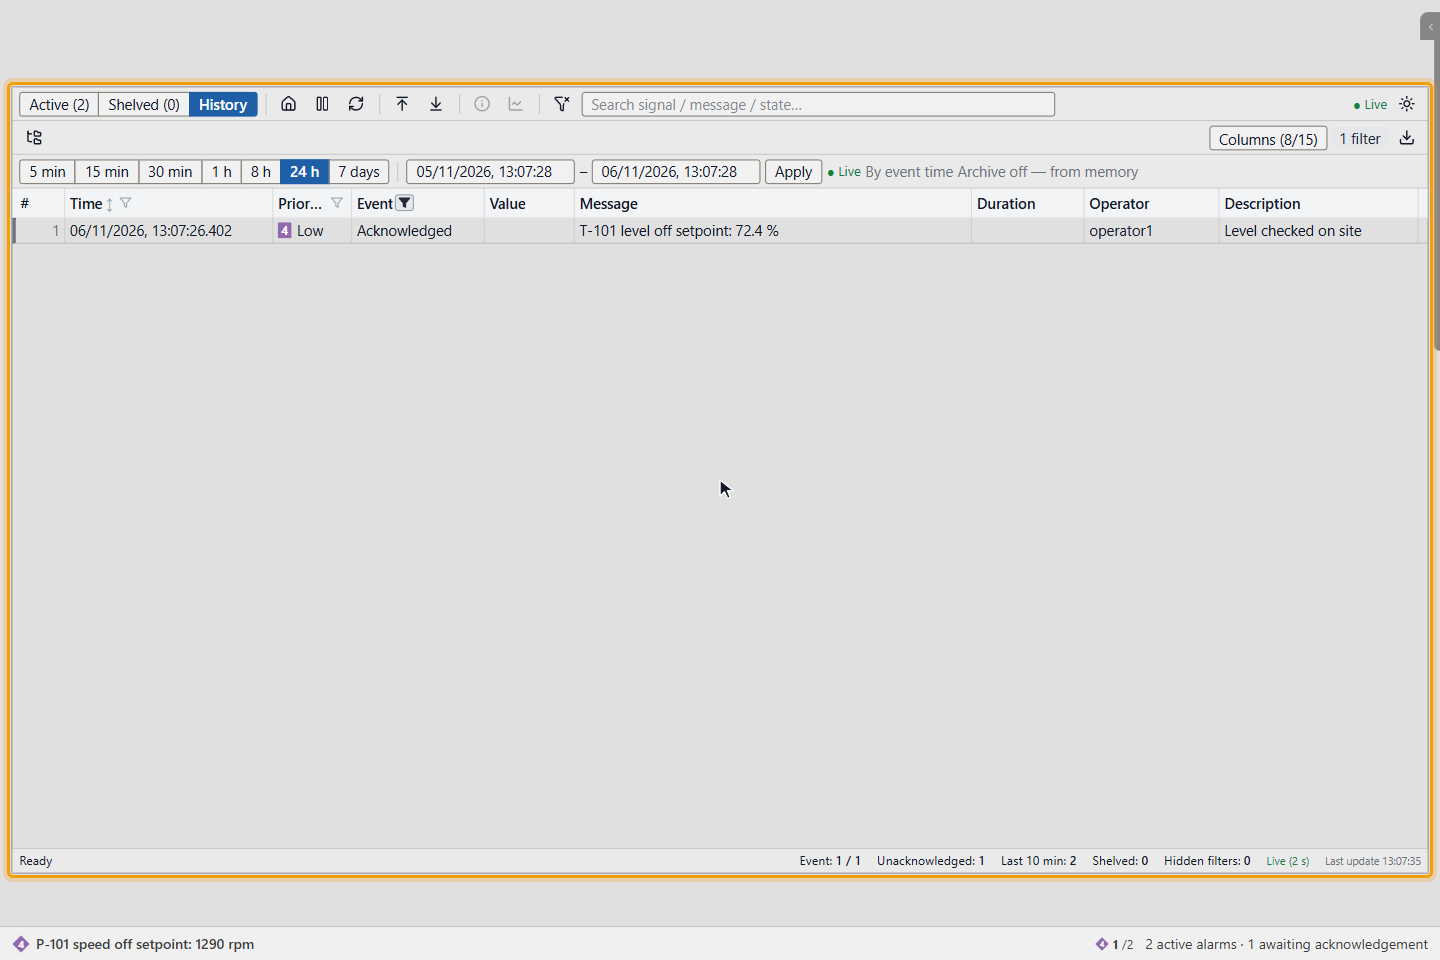
Click the funnel next to a column name, tick values and click Apply. Here the funnel of Event is set to Acknowledged.
| Control | Filters by |
|---|---|
| Time bar | 5 min to 7 days, or a start and an end with Apply. 24 h is the default. |
| Funnel of Time | A date range |
| Funnel of Priority | One or more priorities |
| Funnel of Event | Came, Acknowledged, Gone, Closed by system, Level changed, Shelved and Unshelved |
| Funnel of Source | Events whose value came from Auto, Field, Manual or Simulated. The column is hidden by default. |
| Area filter (area + sub-areas) (the tree button) | A part of the plant |
| Search signal / message / state… | Message or signal |
Clear filters removes the filters and returns to 24 h. Refresh reads the list again. A click on the header of Time switches between newest and oldest first.
3. Choose the columns
Click Columns (n/15). Tick the columns you want and clear the ones you do not need; All and None set them all at once, and the search box finds a column by name. More columns are available than the list shows by default: Source, Came, Acknowledged at, Area, Tag, Device time and Arrival at SCADA. Here Value and Duration are hidden.
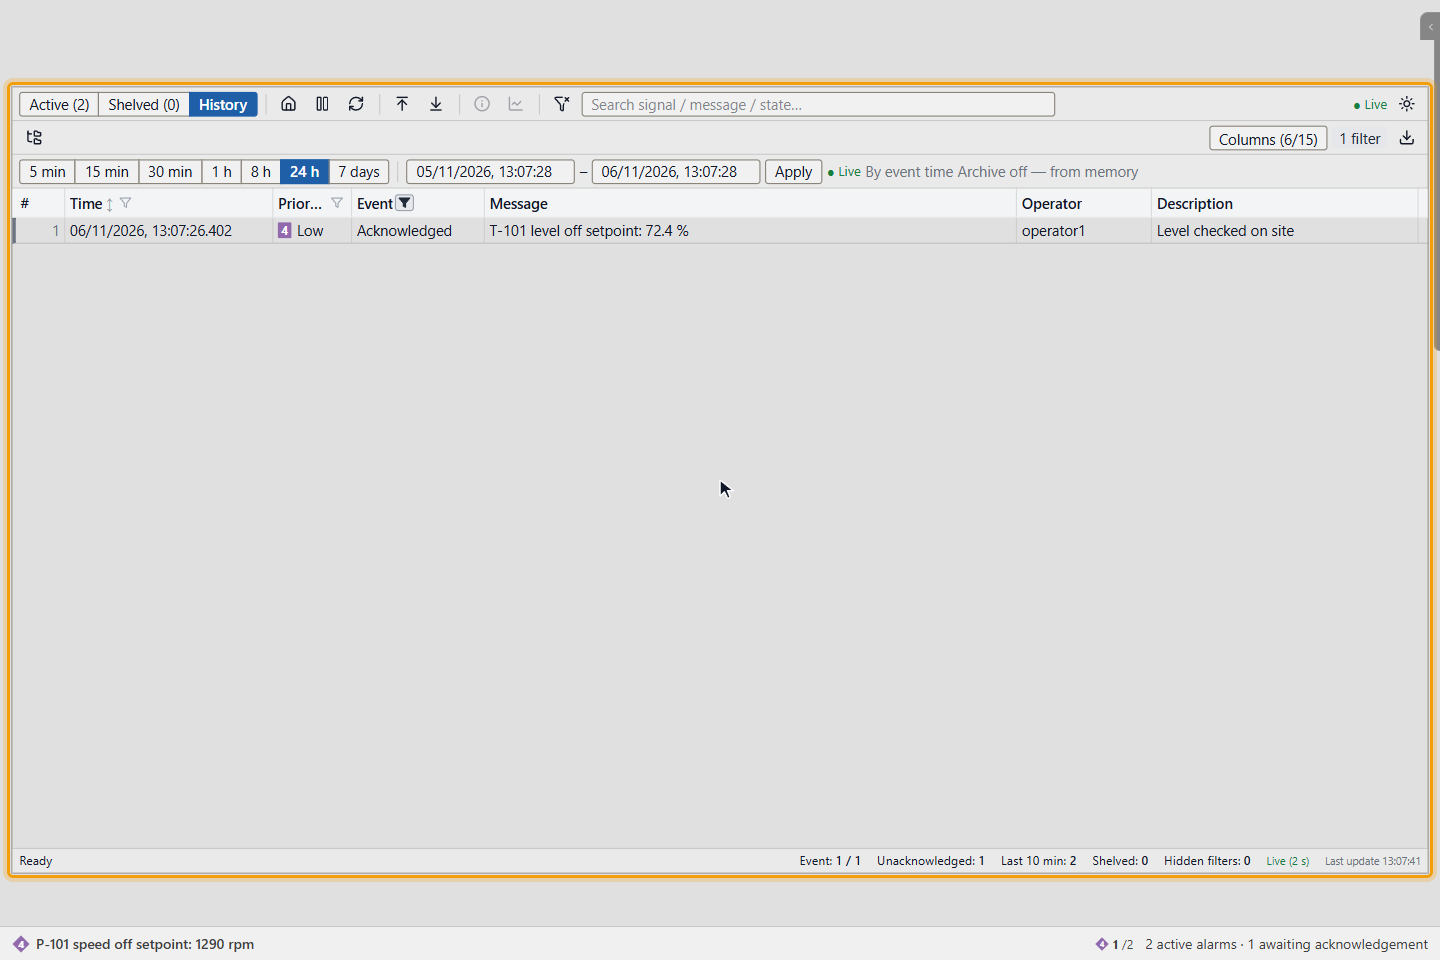
Your choice of columns and filters is kept for you and this list.
4. Save the history to a file
Click Download, the arrow button next to Columns, and choose a format:
| Format | File | Contains |
|---|---|---|
| Excel (.xlsx) | alarm-gecmisi.xlsx | The events that match the filter, with the visible columns, at most 1,000,000 |
| CSV (.csv) | alarm-gecmisi.csv | The events that match the filter, with a fixed set of columns |
| HTML report (.html) | alarm-gecmisi.html | The events that match the filter, at most 20,000 |
| Image (.png) | alarm-gecmisi.png | The visible area of the list |
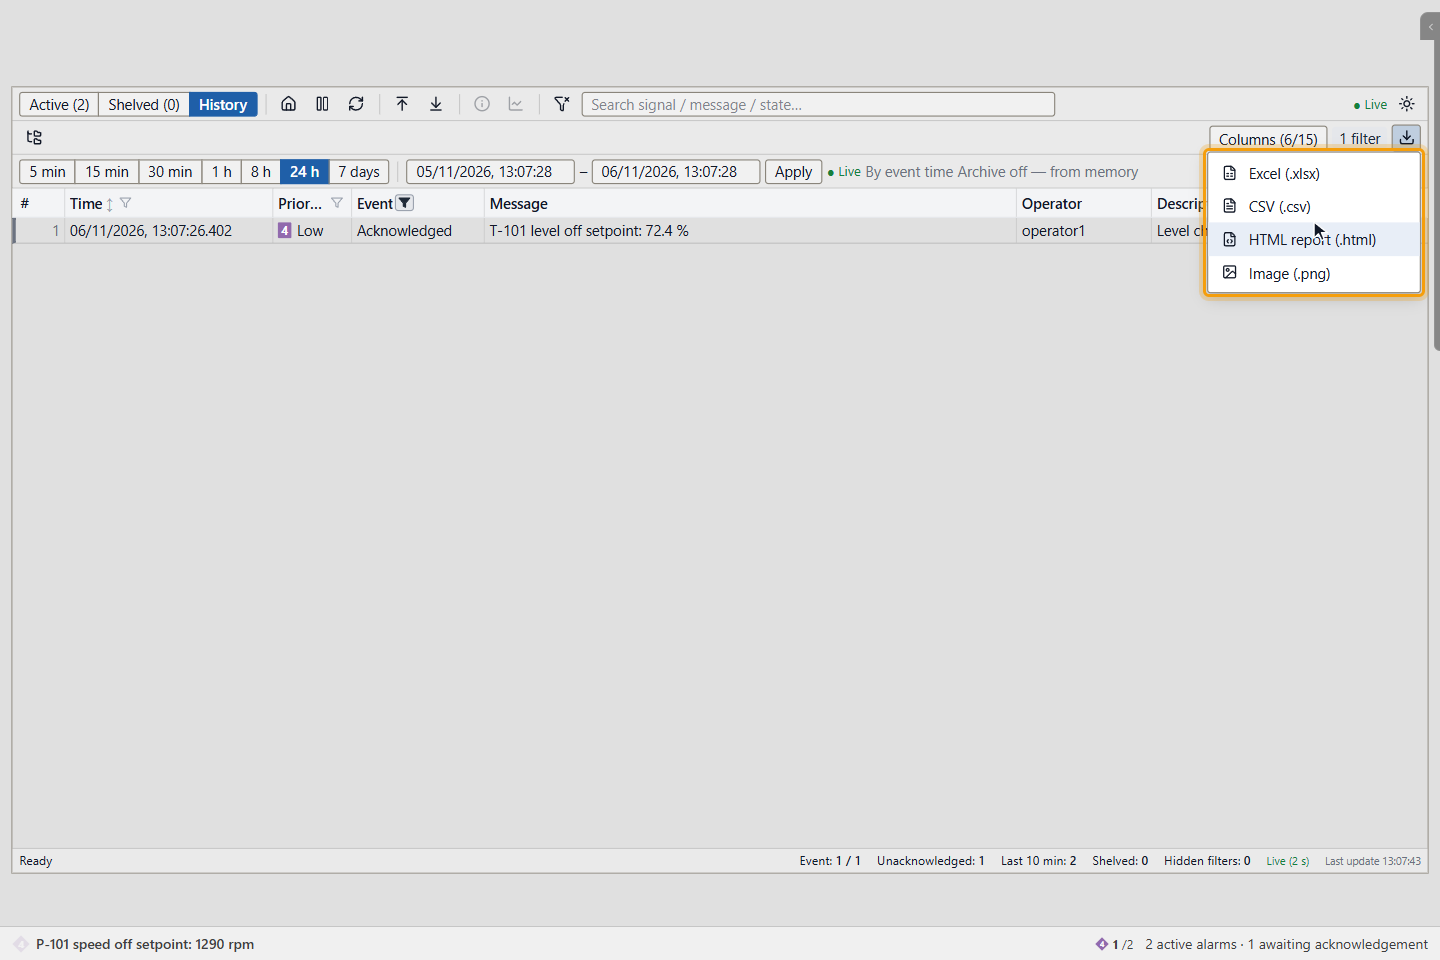
The Excel file leaves out Source, Duration, Came, Acknowledged at, Device time and Arrival at SCADA even when they are visible.
Result
You found the alarm events you were looking for and saved them to a file.
Good to know
- The list shows at most 5,000 events. For more, narrow the filter or download the file.
- The same history also appears in the event list, together with signal changes and commands, if your project has one. See Use the event list.