Work with lists
The signal list, the event list, the command log and the alarm lists on the run screen share one way of working: a search box, a filter in each column header, sorting, a column chooser, a counter and a download. Your choice of columns, filters and sort order is kept for you and that list.
Before you begin
- A page with a list is open on the run screen.
Steps
1. Search and count
Type in the search box, for example a part of the signal name in the signal list, and press Enter. The counter shows the matching rows and the total, for example 12 / 4 500 signals.
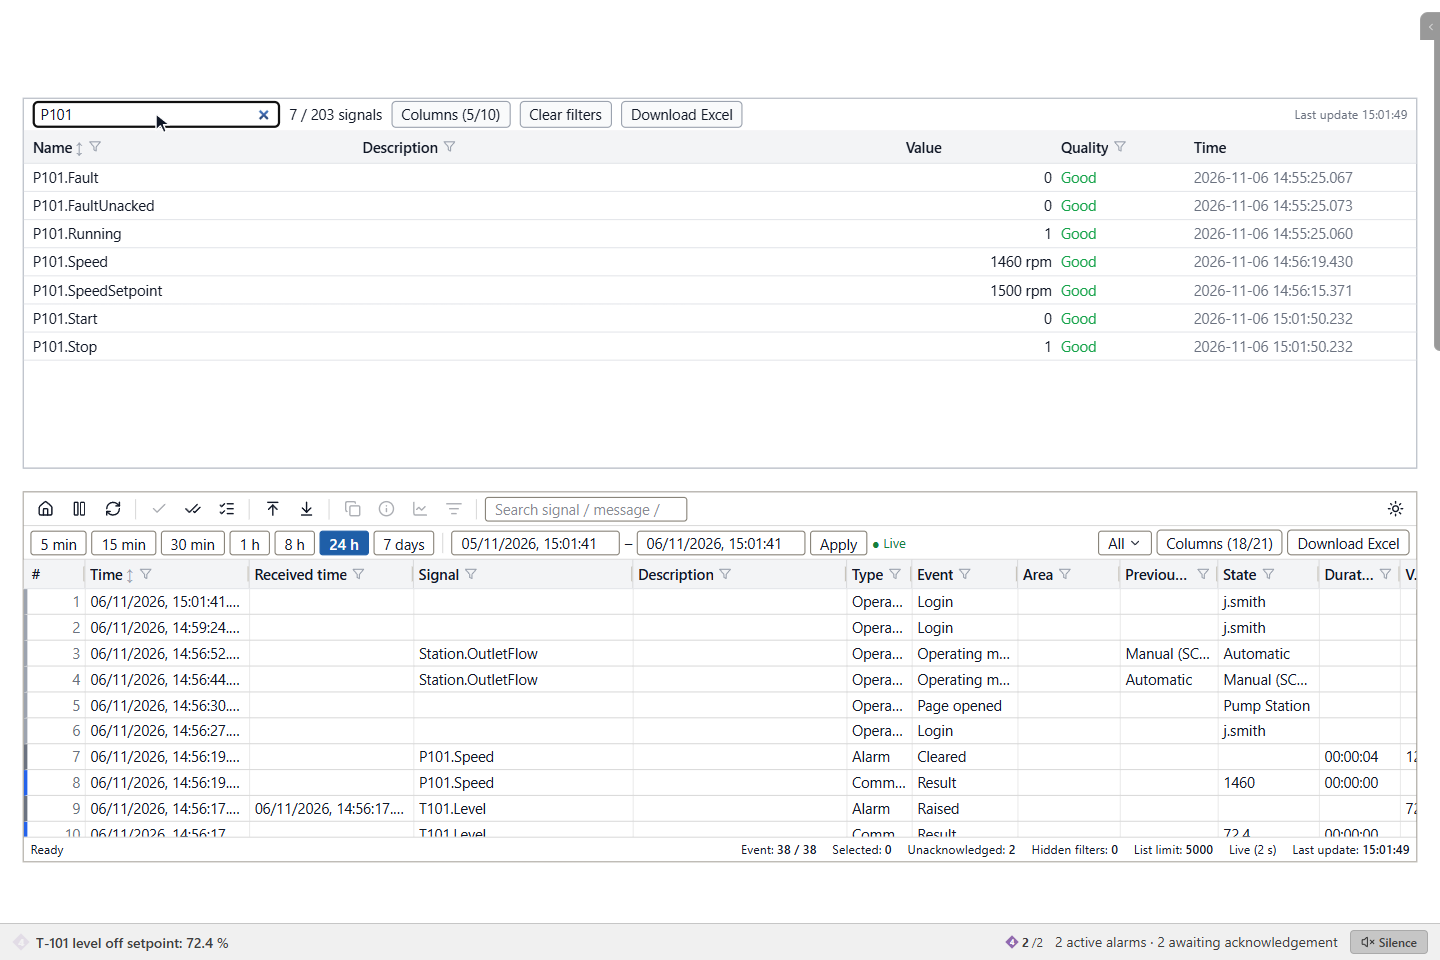
| List | Search looks in |
|---|---|
| Signal list | The name (Search (in name)…) |
| Event list | Signal, message and state |
| Command log | Signal and user |
| Alarm list | Signal, message and state |
2. Filter a column
Click the funnel next to a column name. Depending on the column, enter a text (Contains…), a range, a date range or choose values from a list (with All and None), and click Apply. Clear removes the filter of the column; Clear filters in the toolbar removes all filters and the search.
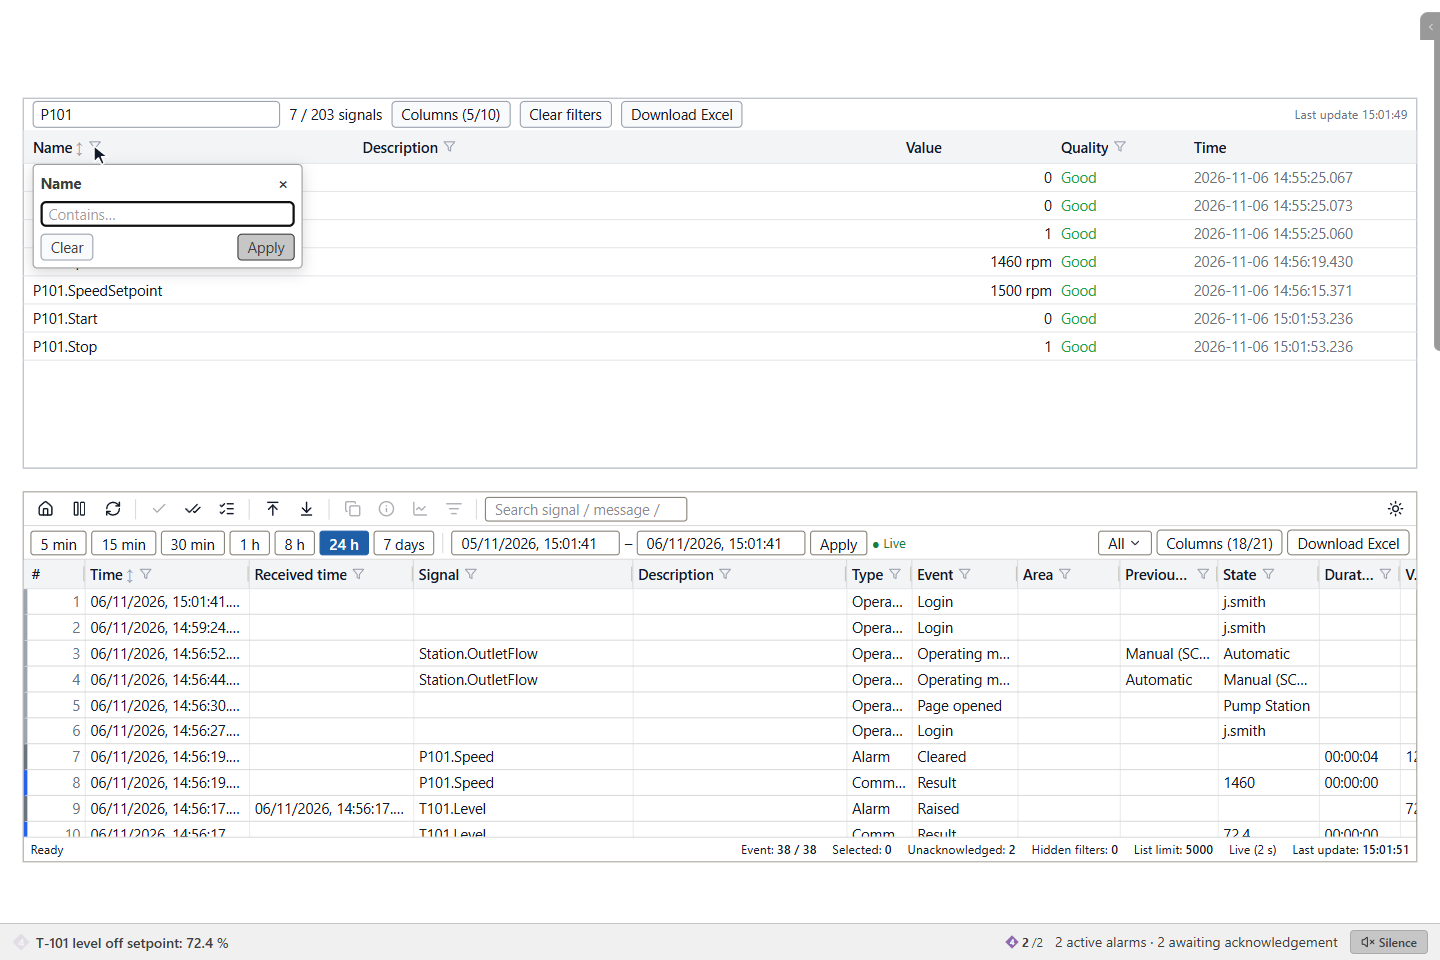
Click a column name to sort by it; in the event list and the command log you can sort by time, newest or oldest first. The alarm list has its own time bar and sort order; see Read the alarm list and the alarm bar.
3. Choose the columns
Click Columns (n/m). Tick the columns to show; Search columns… finds one, All and None select every or no column. The name or time column always stays.
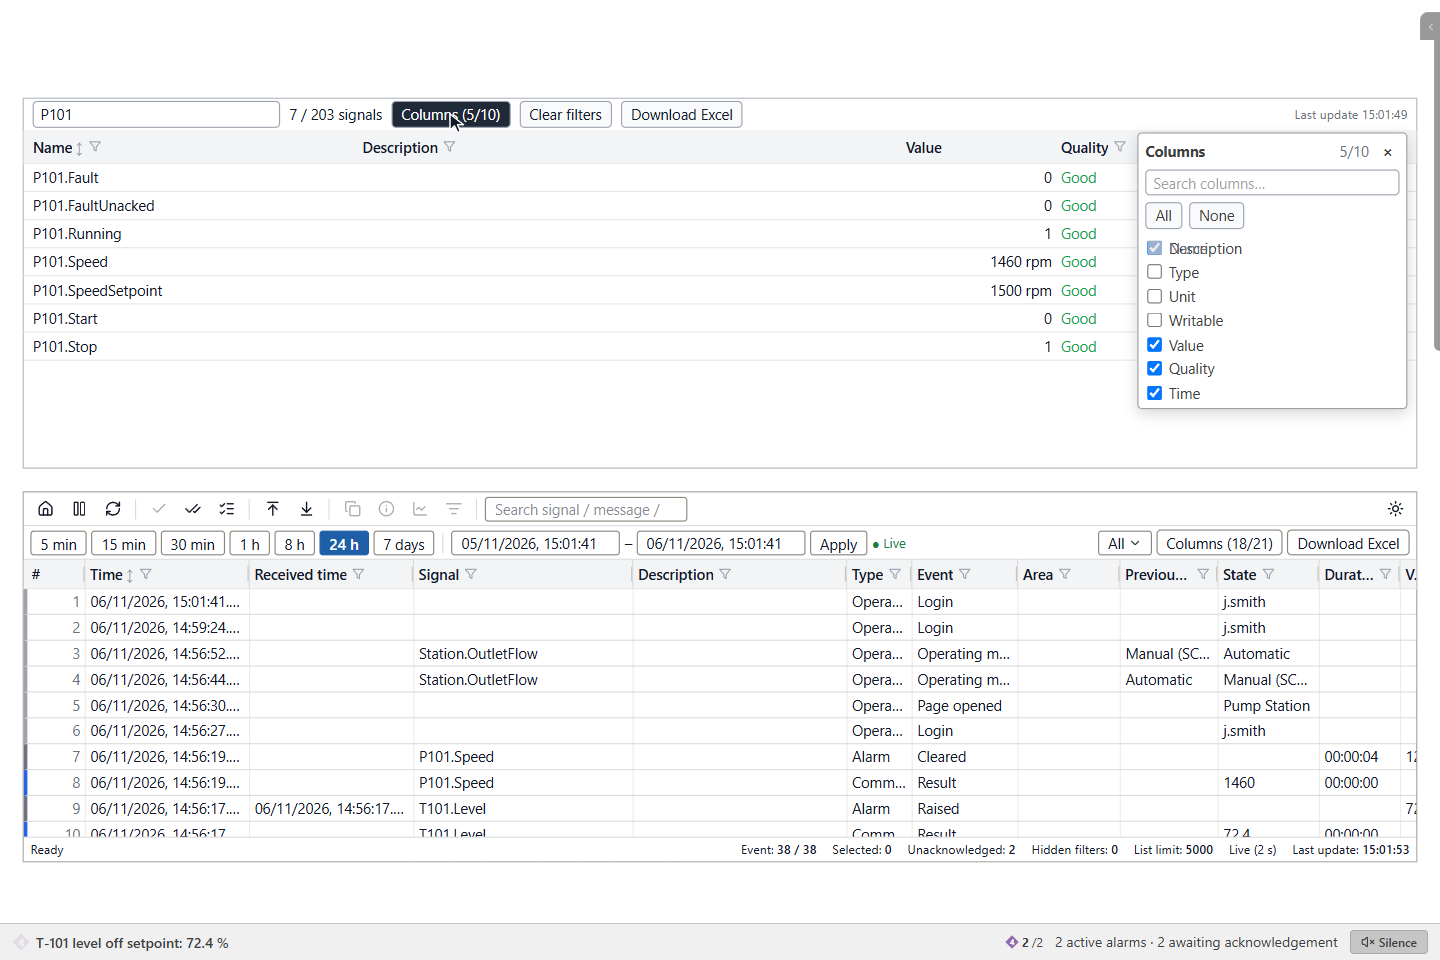
A filter on a hidden column stays active; the toolbar warns about it.
4. Follow new events
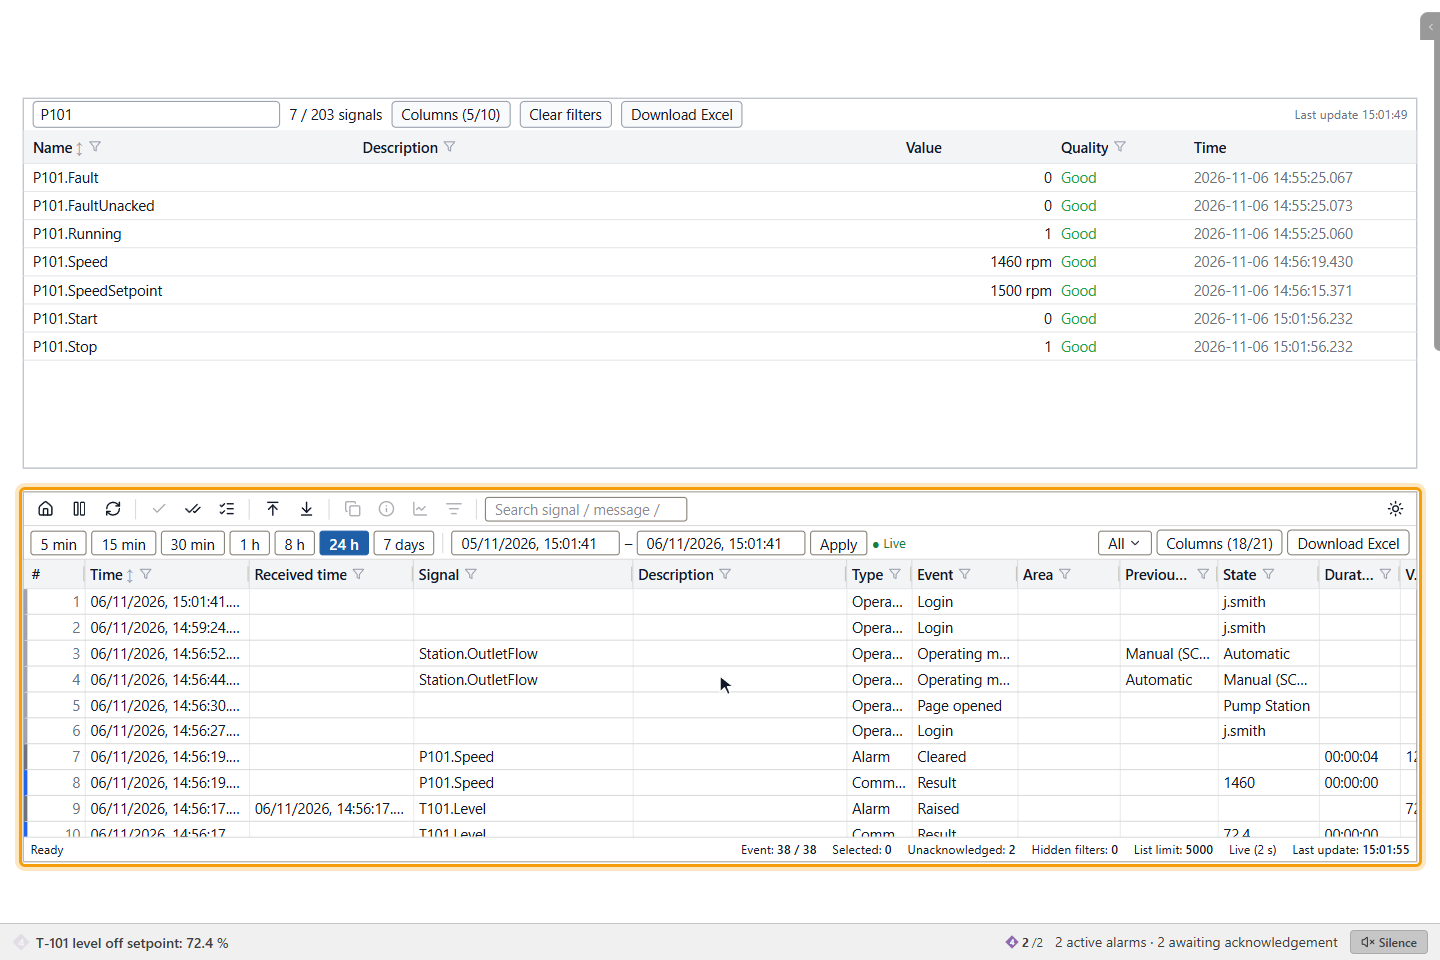
The event list keeps your view while you read: when you scroll away from the top or click Stop, new events are not inserted; a button N new events shows how many arrived, and clicking it shows them. Load more reads further back. See Use the event list for its time bar, views and acknowledge buttons.
5. Plot signals in the trend
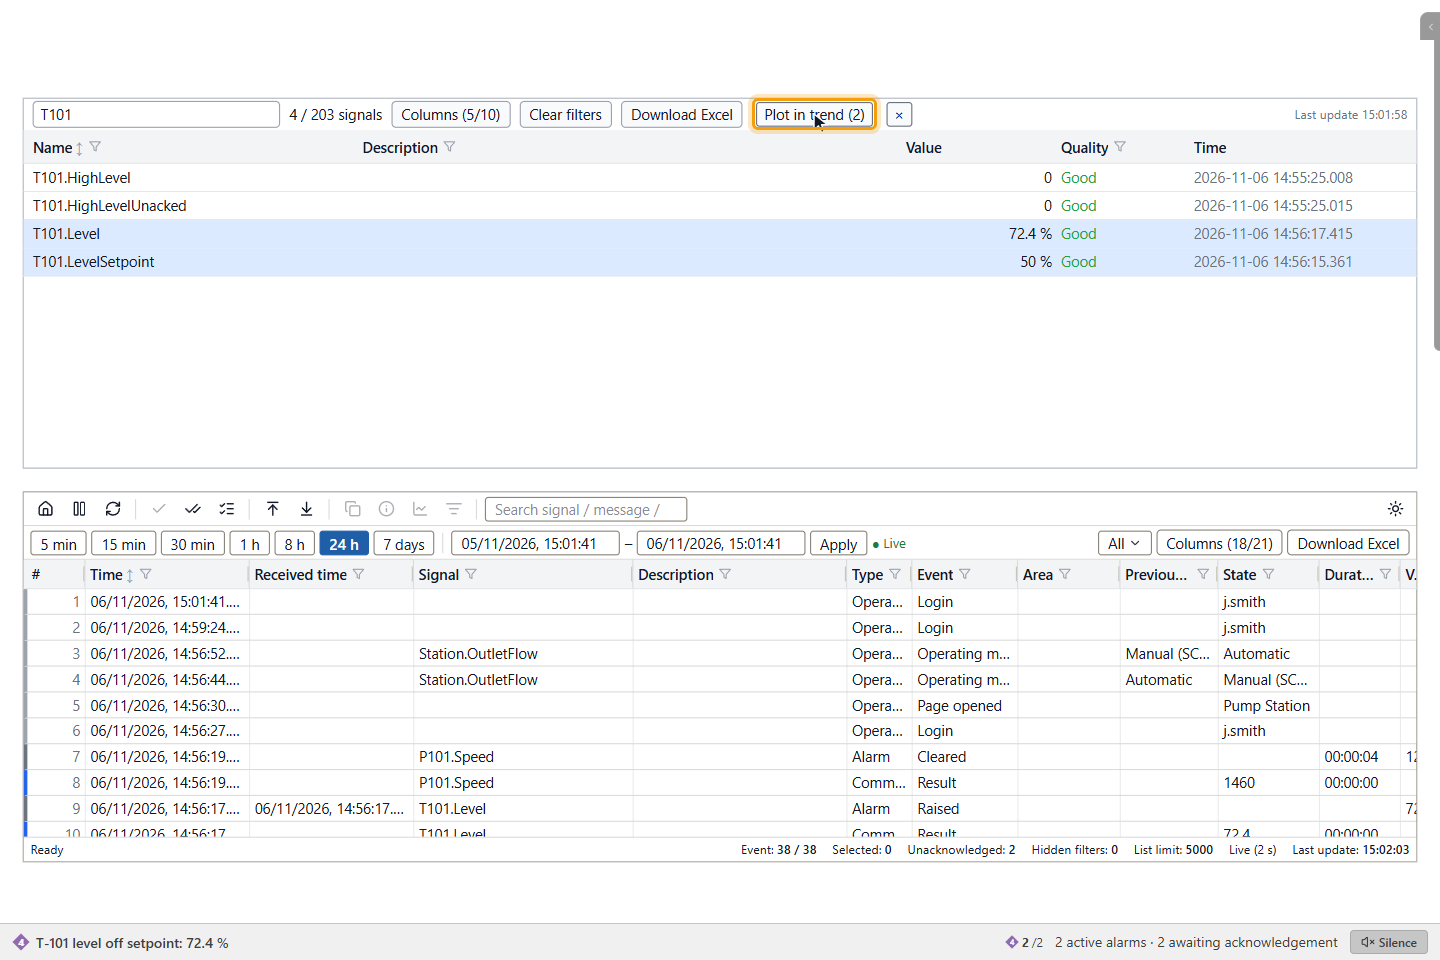
In the signal list, click a row to select it. Ctrl + click adds or removes a row, Shift + click selects every row between two clicks. The toolbar then shows Plot in trend (N); click it to open the trend with the selected signals. × clears the selection, and a new search or filter clears it too.
A trend holds up to eight signals: with more, the first eight are drawn and a message says how many did not fit.
6. Download Excel
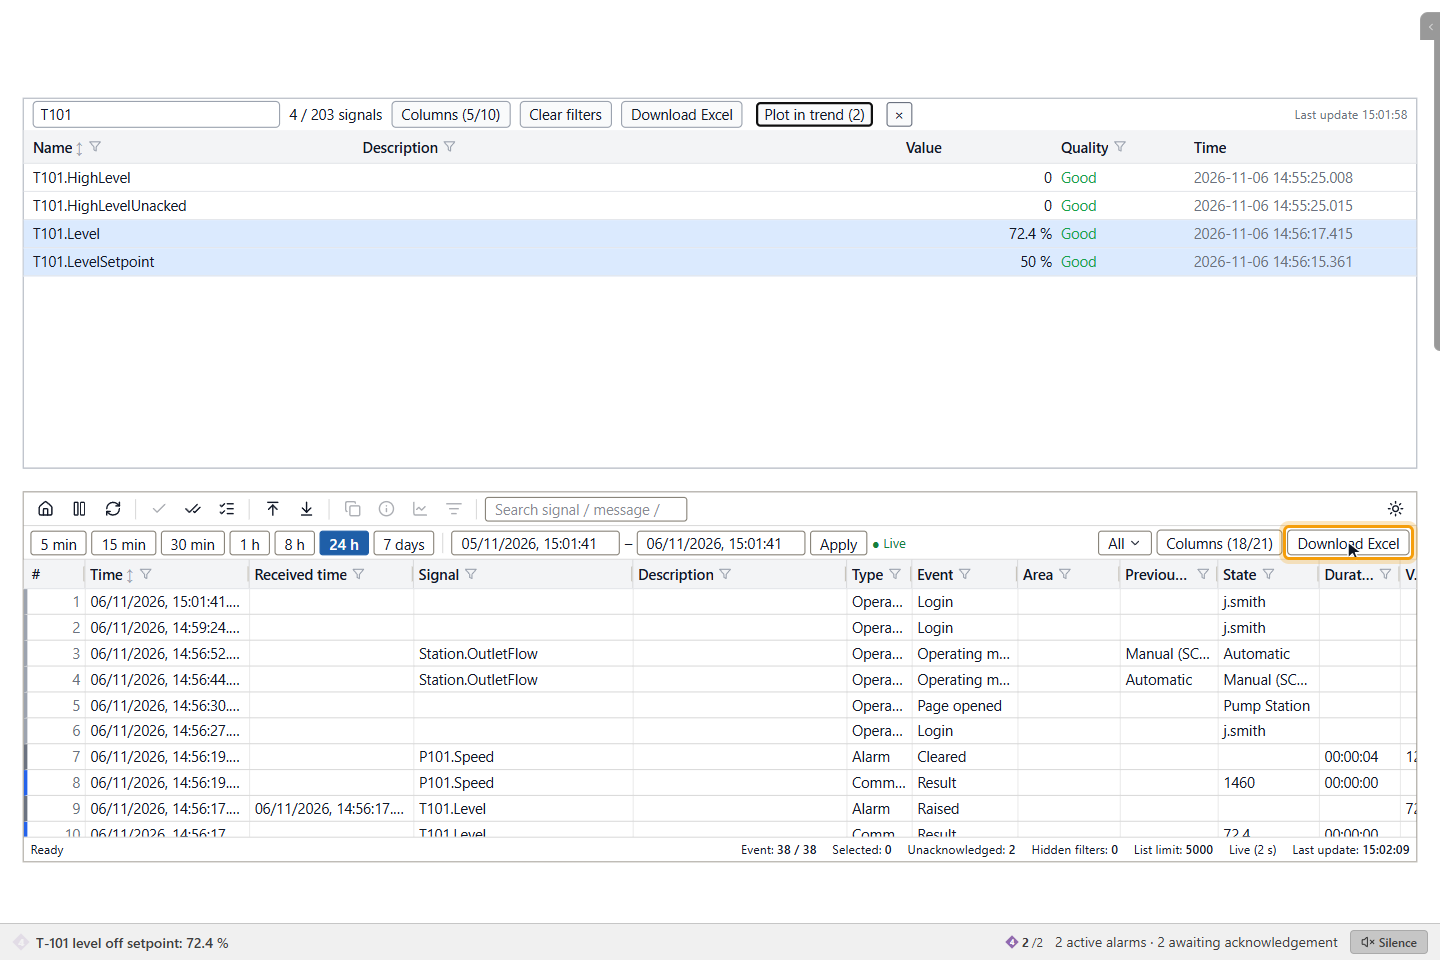
Click Download Excel. The file contains the rows that match the search and the filters, with the visible columns, at most 1 000 000 rows. The signal list exports the definitions of the signals without live values. In the alarm list the button is Download, with a menu of formats; see Read the alarm list and the alarm bar.
Good to know
- Double-click a row of the signal list to open the signal details.
- The Quality column of the signal list filters by Good, Uncertain and Bad while the project is running.
- With user login on, your layout is stored on the server and follows you to other stations; without login it is kept in the browser.
- The command log needs the alarm archive of the server; without it the list says that the archive is not configured.