Use the event list
The event list puts everything that happened in the plant into one chronological list: a breaker that opened, the alarm that followed, the command an operator sent and who signed in. It is read from the events table of the history database, so it shows the past as well as the present. On a screen it is the Event List object; it works on the run screen.
Before you begin
- A page with an Event List object is open on the run screen. See List objects.
- The project has a history database. Without one the object shows This project has no event history.
- To acknowledge alarms from the list, your user needs the permission to acknowledge alarms. Without it the acknowledge buttons stay grey with the tip No permission.
Steps
1. Read the list
From top to bottom, the list has a toolbar, a time bar, the column headers, the rows and a status bar. The newest event is at the top.
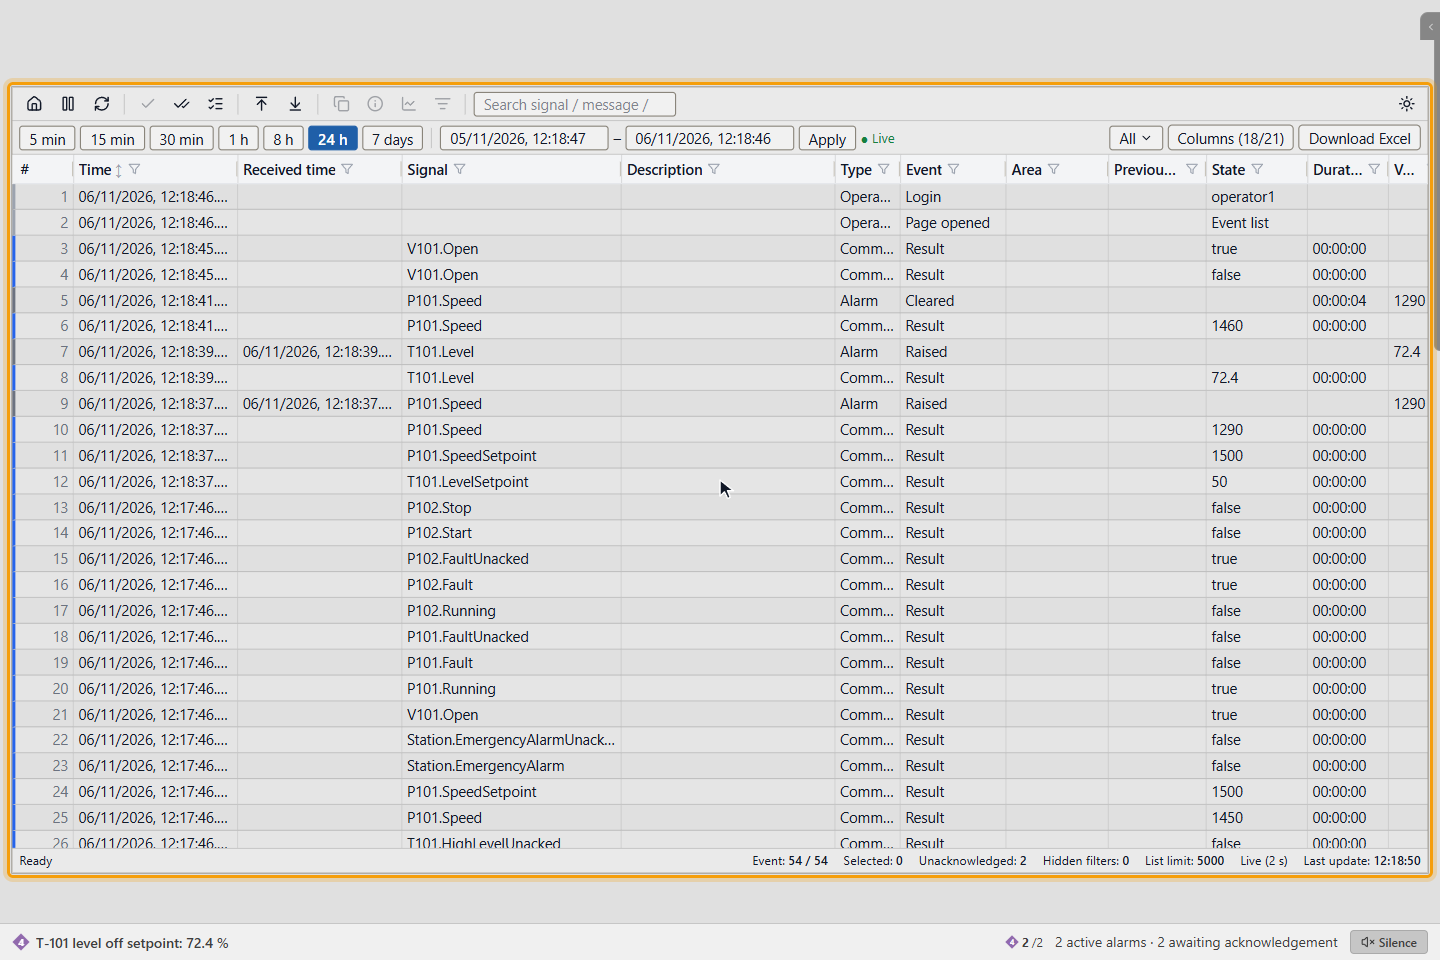
The toolbar buttons show their name when you point at them:
| Button | Effect |
|---|---|
| Default view (house) | Returns to the filters, search, time range (24 h), order and columns of a new list. Column widths stay. |
| Stop, Run | Stops and restarts the flow of new events; see step 8 |
| Refresh | Reads the list again |
| Acknowledge selected alarms, Acknowledge all unacknowledged alarms in the list, Acknowledge all matching | See step 5 |
| To top (newest), To end (oldest loaded) | Scroll the list |
| Copy selected rows (Ctrl+C) | Copies the selected rows with their headers, separated by tabs |
| Signal details, Open trend, Events of this signal | Work on the selected row |
| White background, Screen-color background | Switch the background of the list. The screen color is the default. |
The status bar shows the state of the list (Ready, Querying…, Stopped, Error), the counter Event, Selected and Unacknowledged, which counts the alarms awaiting acknowledgement in the whole project. Hidden filters counts the filters on hidden columns. Active view appears when a view other than All is open. List limit is 5000 rows. The last two fields show Live (2 s), Stopped or History, and Last update.
| Column | Shows | Filter |
|---|---|---|
| # | The position among the loaded rows | None |
| Time | The valid device time, otherwise the time of arrival. The list is sorted by this time. | Date range |
| Received time | When the event reached YTCC | Date range |
| Device time | Hidden by default. The time sent by the device, None without one, ? Invalid when the device marks it invalid | None |
| Time quality | Hidden by default. Valid, No device time or Invalid (IV) | Values |
| Delay | Hidden by default. Received time minus Device time | None |
| Signal | The full signal name | Text; contains, with * and ? as wildcards, case-sensitive |
| Description | The description of the point | Text; contains |
| Type, Event | See Event kinds | Values |
| Area | The area of the signal | Text; exact name |
| Previous state, State | The state before and after the event | Text; contains |
| Duration | How long the condition lasted | Range, in seconds |
| Value, Quality | The value and the quality of the signal | Range |
| Priority | The alarm priority, with a numbered badge | Values |
| User, Computer, Result, Message | Who, from which computer, the result and the text | Text; contains |
| M | The value source: a filled M for a manual value entered in SCADA, an outlined M for a manual value from the field, a dashed S for a simulated value | Values |
Device time, Time quality and Delay stay empty for commands, system events, operator actions, and for the acknowledge and clear events of alarms. Columns (n/m) shows and hides columns. To change a width, drag the right edge of a column header. Widths are kept in this browser, for this project and this list.
2. Choose the time range
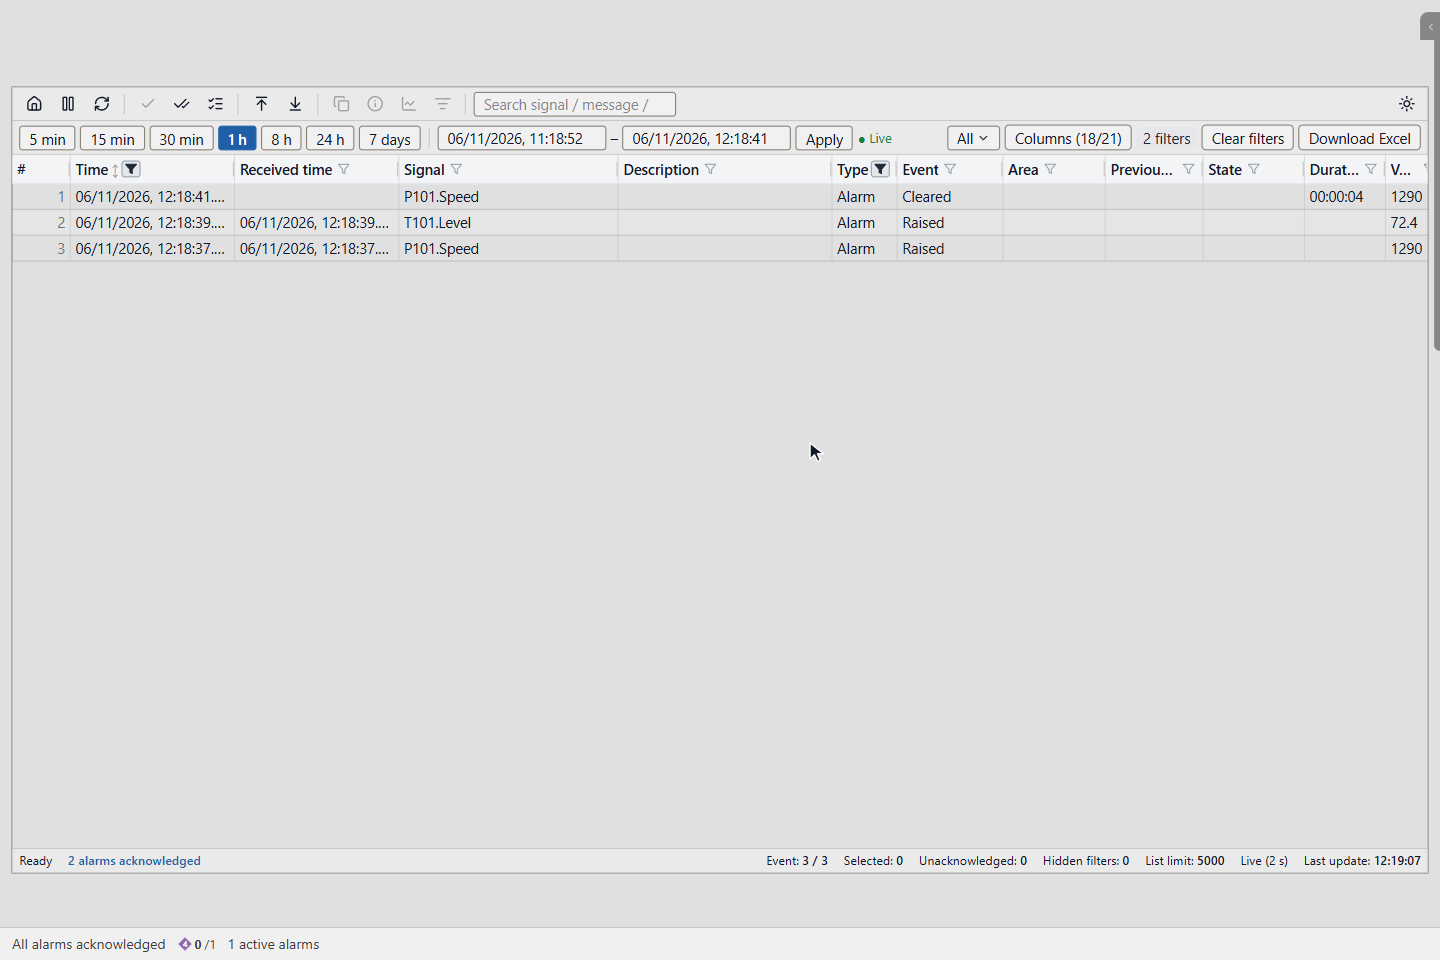
Click 5 min, 15 min, 30 min, 1 h, 8 h, 24 h or 7 days in the time bar. A new list shows 24 h. Here 1 h is chosen.
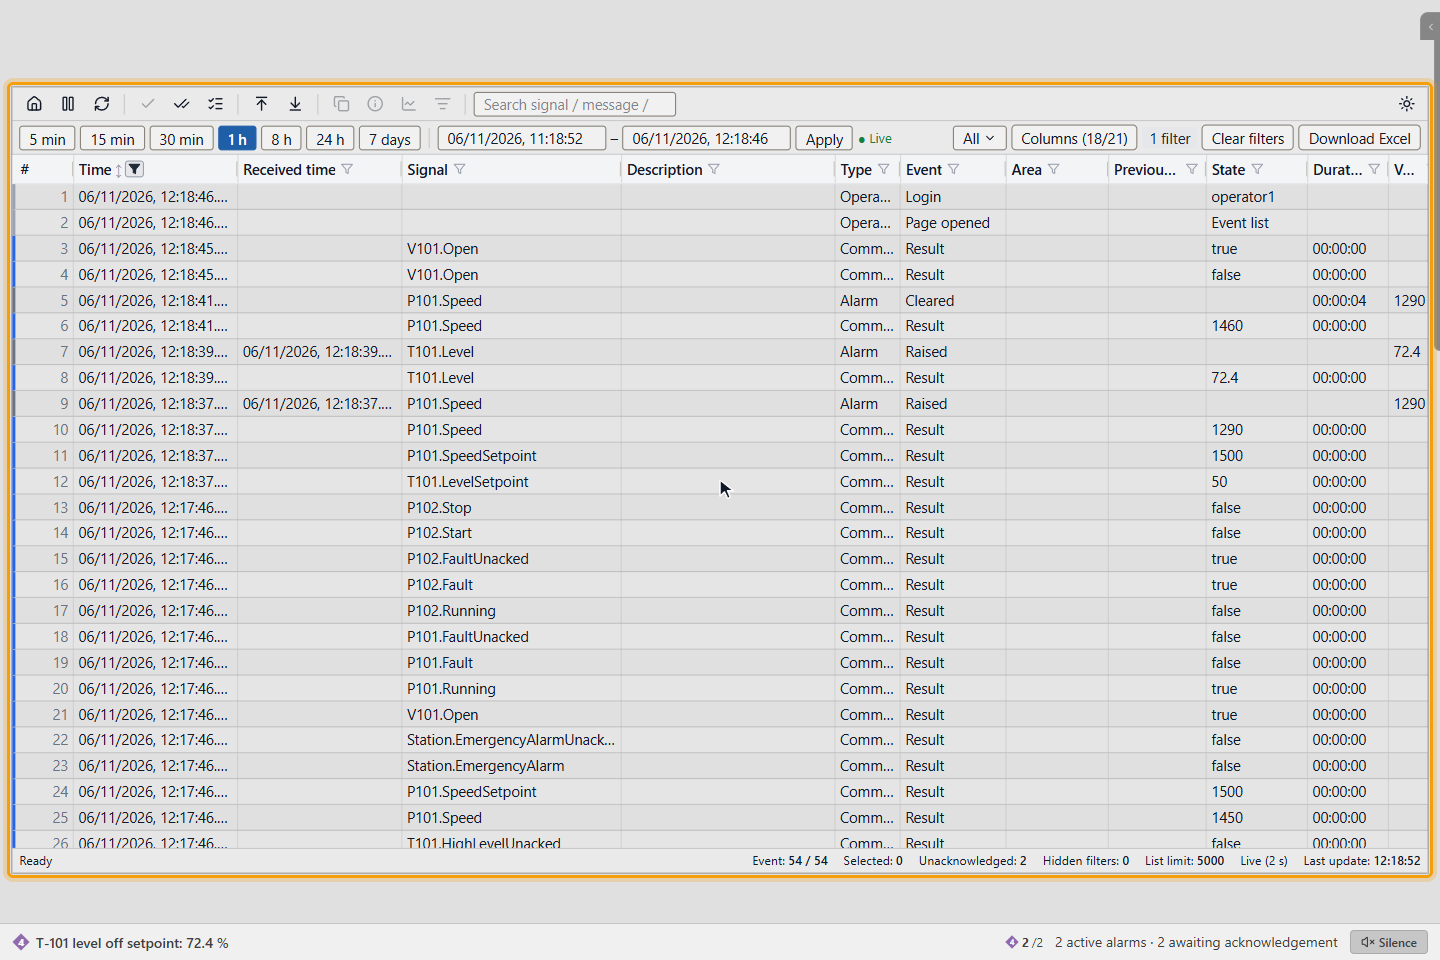
To see a fixed period, type the start and the end into the two boxes and press Enter or click Apply. A range can be 31 days at most; otherwise Apply stays grey with the tip Enter a valid range (31 days at most).
While the list shows the newest events and has no fixed end, ● Live appears and the list reads new events every 2 seconds. The end box then shows the time of the latest event. With a fixed end the status bar shows History.
3. Filter a column
Click the funnel next to a column name. Enter a text, a range or a date range, or tick values, and click Apply. Here the Type column is set to Alarm.
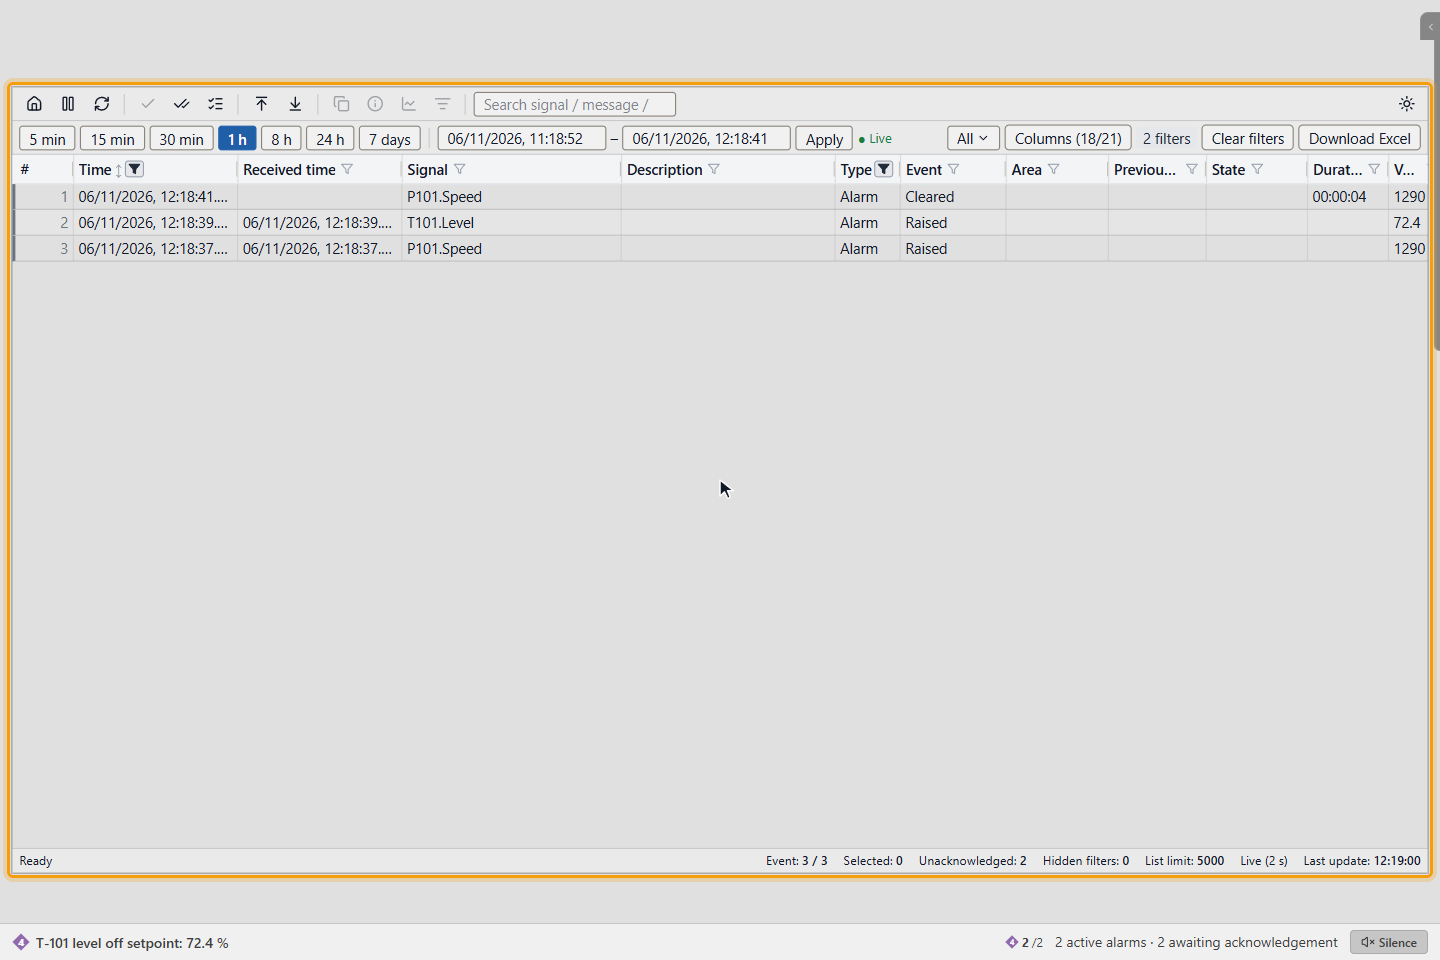
Every filter runs on the server, so it also covers rows that are not loaded. Clear removes the filter of one column; Clear filters removes all filters and the search and returns to 24 h. The search box Search signal / message / state… looks in the signal, the message and the state.
The text search and the counter need a time range of 31 days or less, and the counter stops at 10 000. Click the Time header to sort the oldest first.
4. Select rows and open the menu
Click a row to select it. Ctrl + click adds or removes a row, and Shift + click selects a range. Ctrl+A selects the loaded rows, Ctrl+C copies the selection and Esc clears it. Double-click a row to open the signal details.
Right-click a row to open its menu: Signal details, Open trend, Events of this signal, Acknowledge, Copy and Reset column widths.
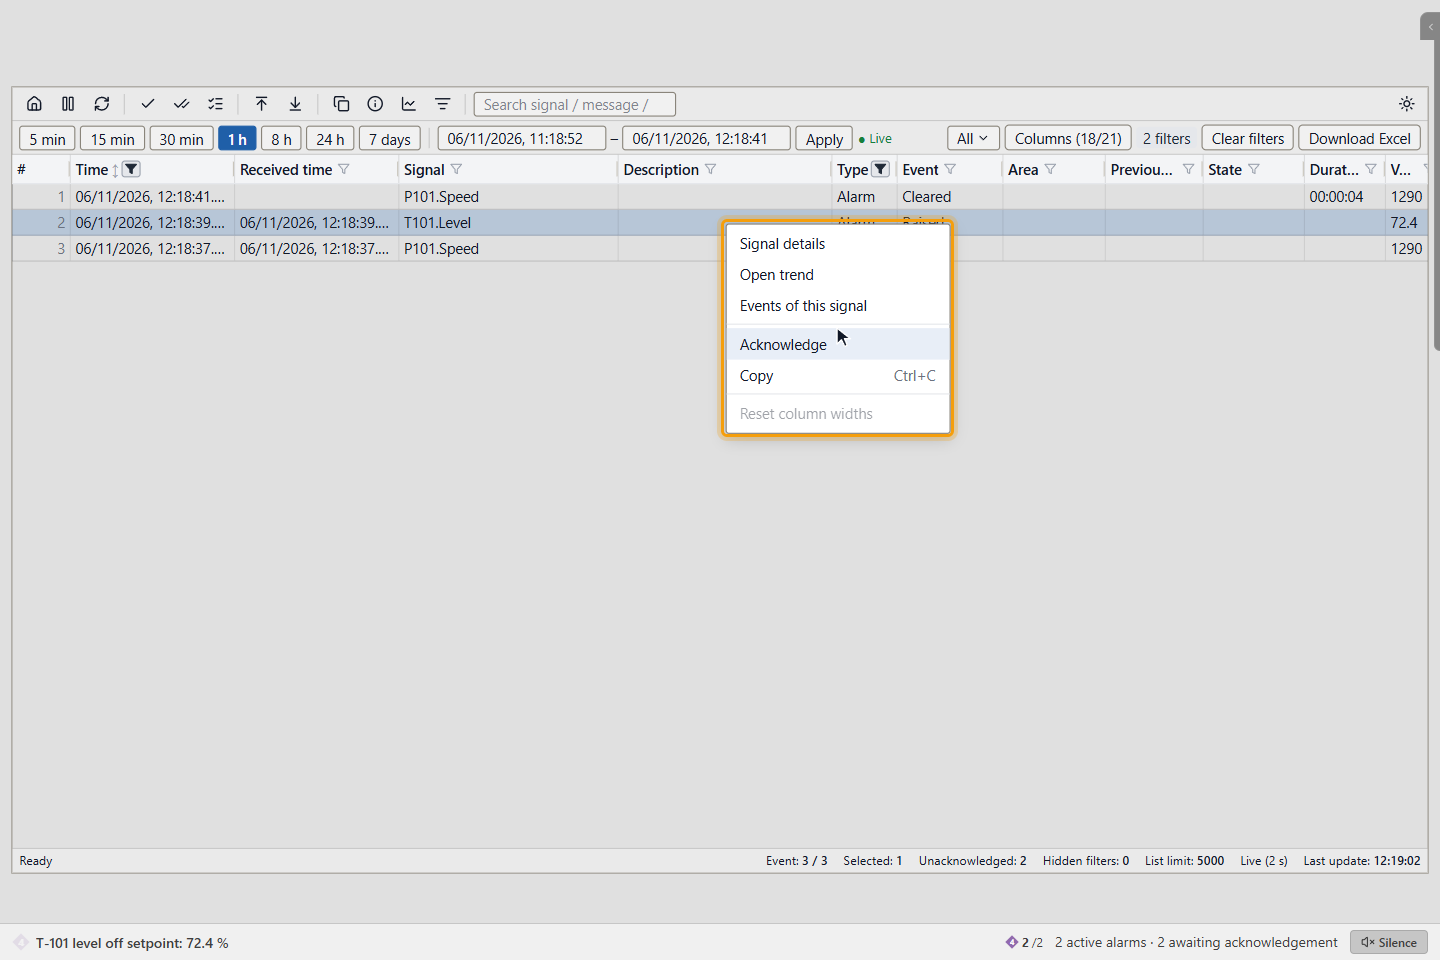
Events of this signal filters the list to one signal. A chip with the signal name appears in the toolbar; click its ✕ to remove the filter.
5. Acknowledge the alarms that match
The list has three acknowledge buttons:
| Button | Acknowledges |
|---|---|
| Acknowledge selected alarms | The selected alarm rows |
| Acknowledge all unacknowledged alarms in the list | The unacknowledged alarms among the loaded rows |
| Acknowledge all matching | Every unacknowledged alarm that matches the filter, also rows that are not loaded |
Click Acknowledge all matching. YTCC first counts on the server and shows Unacknowledged alarms matching the filter will be acknowledged: n. Click Acknowledge all matching (n), or Cancel to keep them.
The selection covers the active alarms that you may see and act on, with the same permission and responsibility zones as Acknowledge all in the alarm list. Each acknowledgement is recorded as an Acknowledged event.
- With no match the status bar shows No unacknowledged alarms match the filter.
- One click acknowledges at most 10,000 alarms by default. The window then says At most this many per click and press again for the rest.
- Filters on user, computer, result, state, duration, quality and received time cannot be applied to active alarms. YTCC then shows This filter cannot be applied to active alarms and acknowledges nothing. Remove those filters first.
6. Read the sequence of events
Click the view button in the time bar, which shows All by default. Choose SOE.
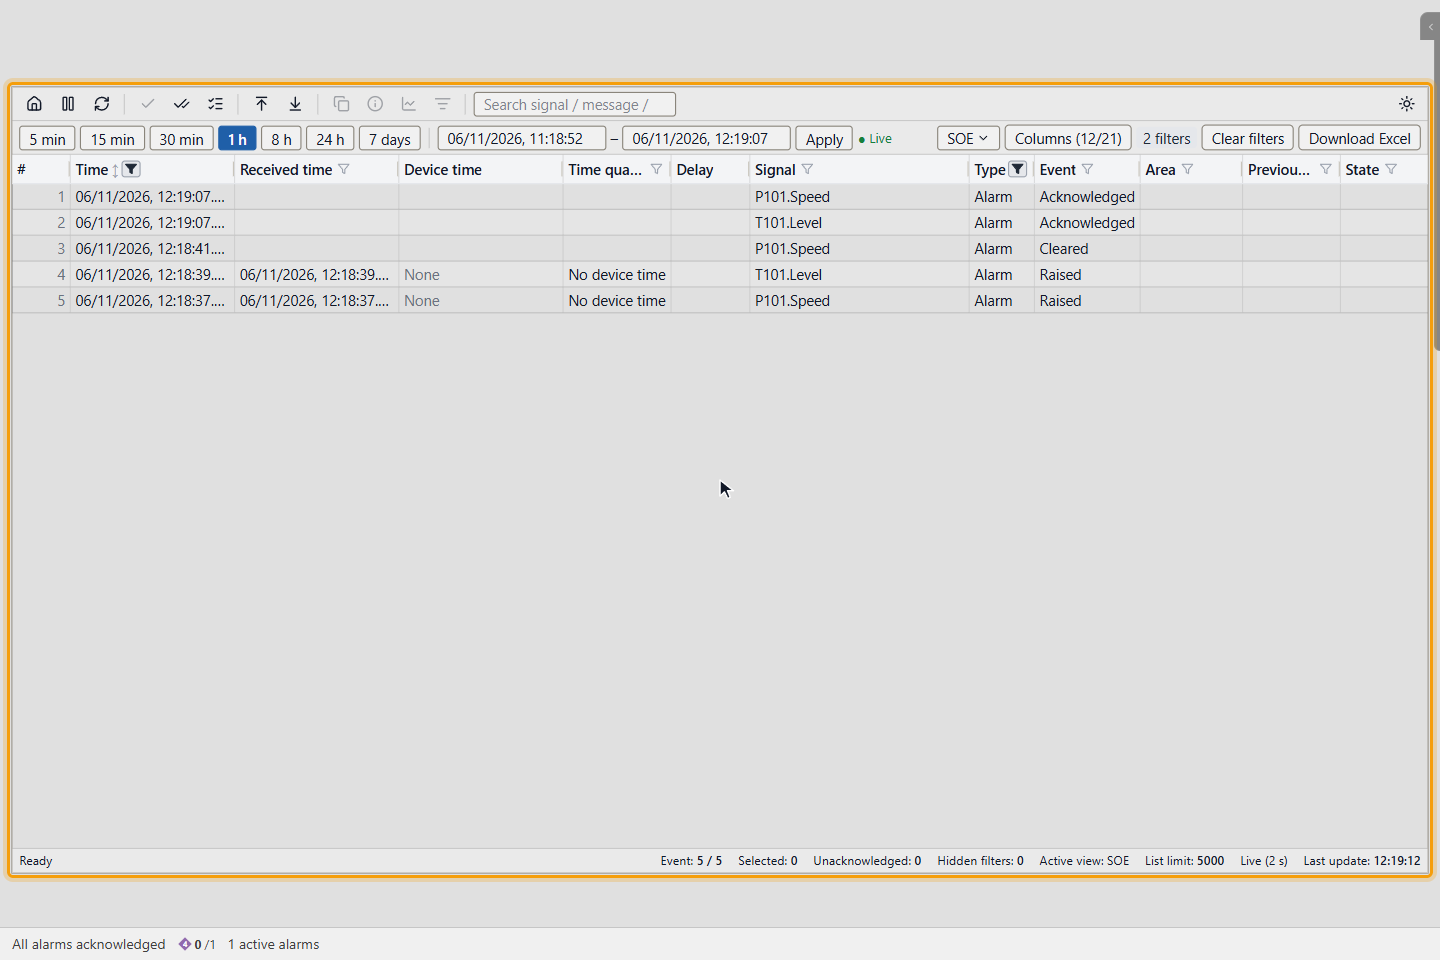
The SOE view shows signal and alarm events in the order they happened at the device. Read it like this:
- Time is the valid device time, or the time of arrival when there is none.
- Time quality tells which one you are reading. No device time means the protocol sends no time, so Device time shows None. Invalid (IV) means the device marked its time as invalid.
- Delay shows how long the event took to reach YTCC.
The view menu has four built-in views:
| View | Columns besides Time | Event types |
|---|---|---|
| All | The default columns | All |
| SOE | Received time, Device time, Time quality, Delay, Signal, Type, Event, Area, Previous state, State, Quality | Signal, Alarm |
| Alarms only | Signal, Description, Event, Area, Previous state, State, Duration, Priority, User, Message, M | Alarm |
| Operator actions | Signal, Description, Type, Event, Area, State, User, Computer, Result, Message | Command, Operator |
Choosing a view keeps the time range, the search and the filters of other columns. The sort order returns to newest first. An asterisk on the view button means that you changed something since you opened the view.
7. Save a view
Set the columns and filters you want. Open the view menu and click Save view…. Type a View name, here Pump events, and click Save view.
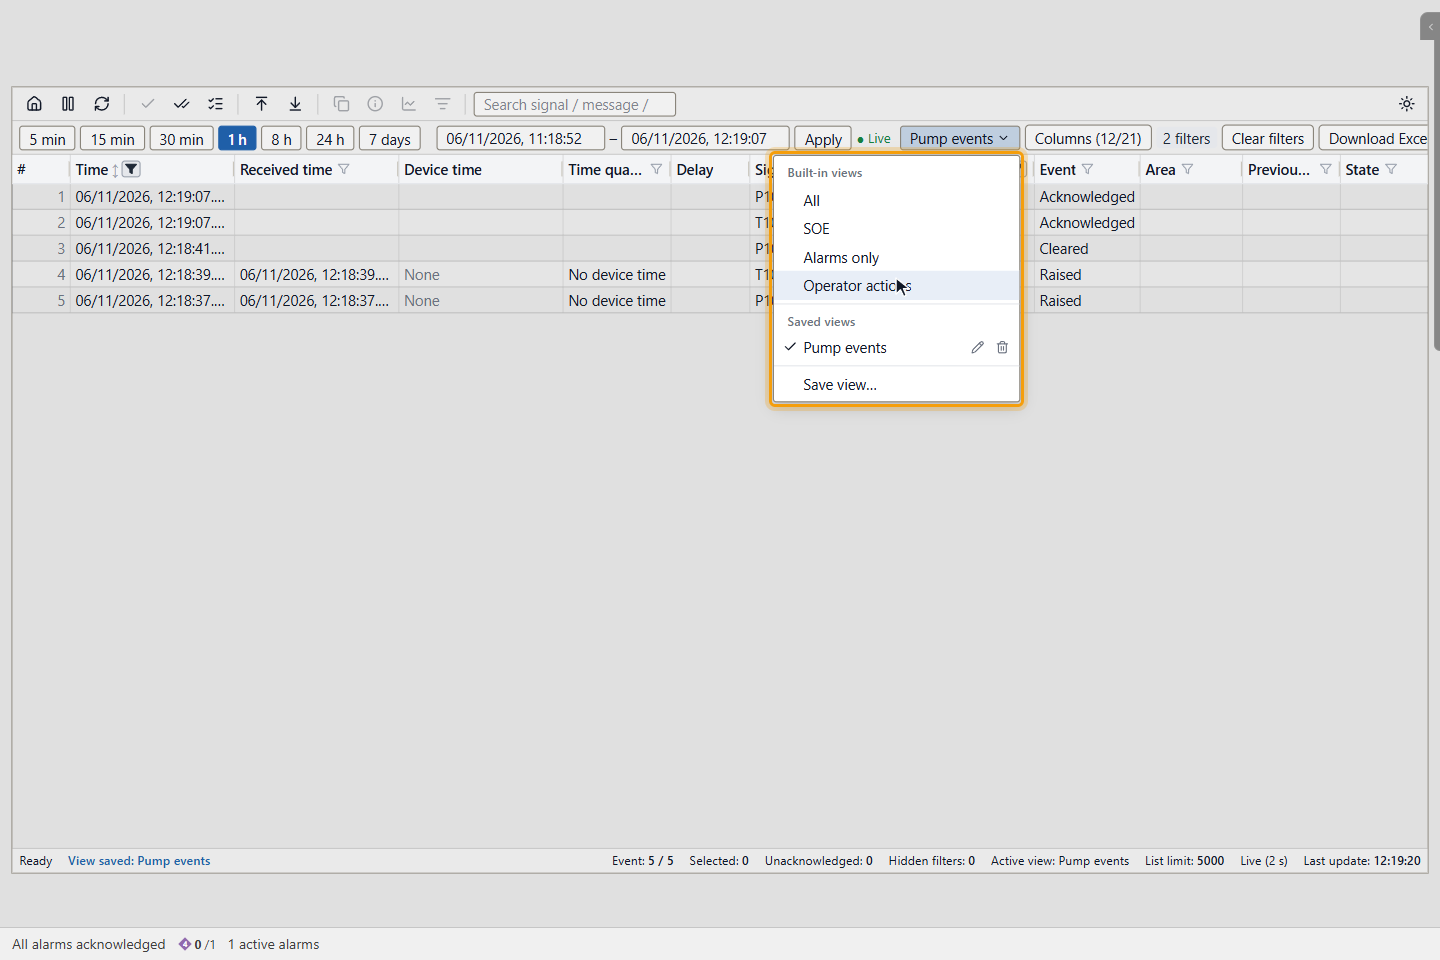
A saved view keeps the visible columns, the filters, the sort order and the search. It also keeps a preset time span such as 1 h. A fixed date range is not saved; opening the view keeps the current range. A name that exists is overwritten after a note in the window.
Under Saved views, the pencil renames a view and the bin deletes it. A list holds up to 20 saved views with names of up to 60 characters. Views belong to your user and this list. With user login they are stored on the server and follow you to other stations; without login they stay in the browser.
8. Stop the list and go back to the default view
Click Default view to reset the list. Then click Stop to hold the rows while you read. New events are still counted: N new events appears in the toolbar and the status bar shows Stopped.
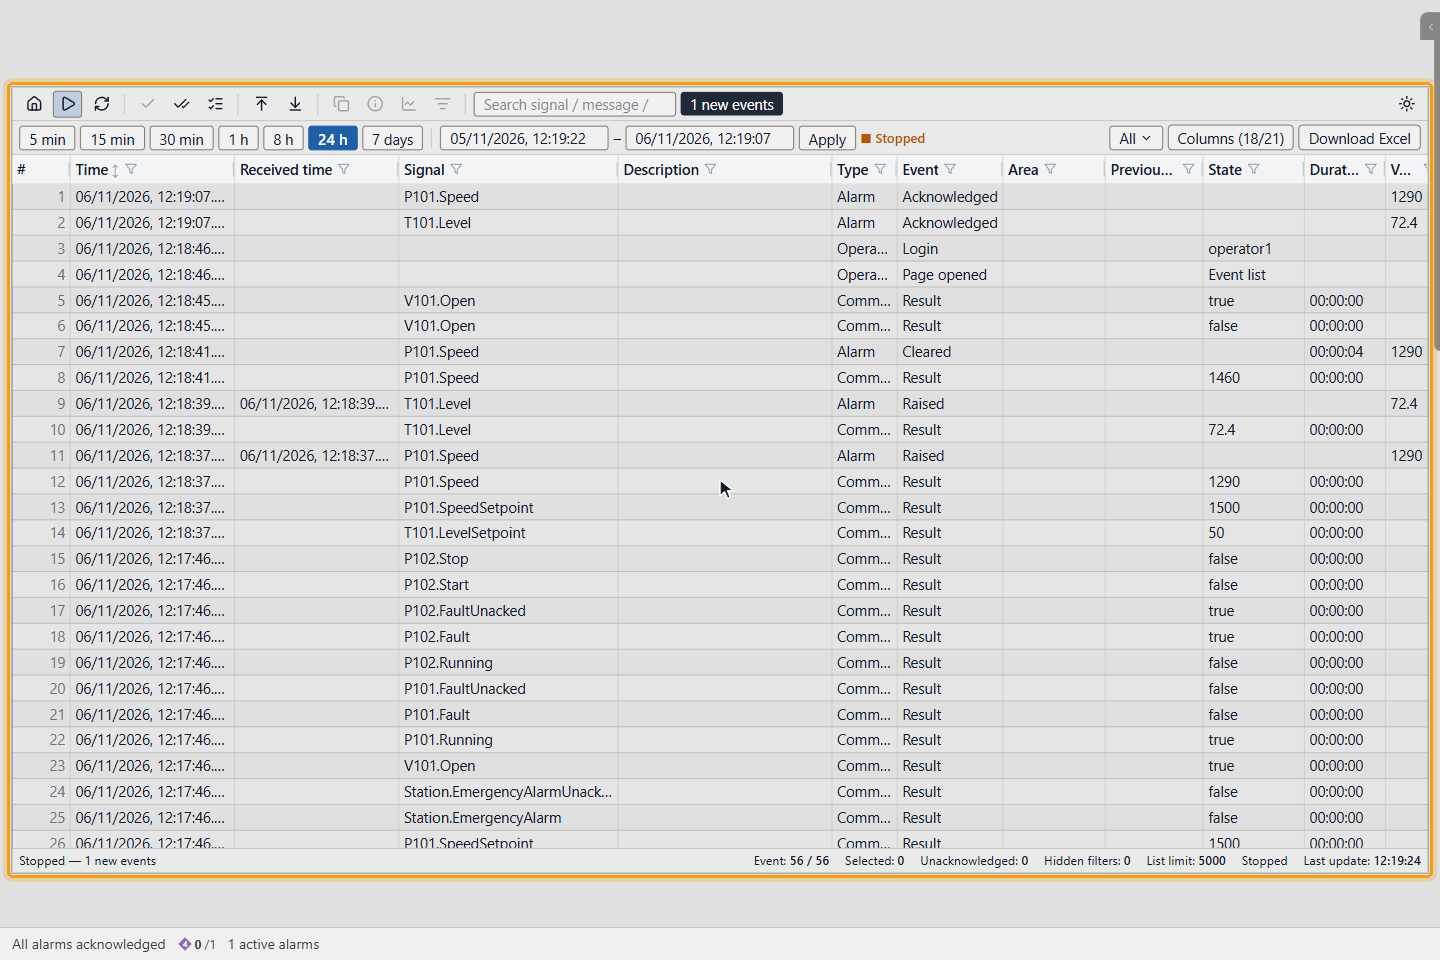
Click Run or N new events to let the events flow in again. The same button appears when you scroll away from the top, because new rows are not inserted while you read.
Result
You found the events you were looking for, acknowledged the alarms that match, and kept your layout as a view.
Event kinds
| Kind | Event types | Recorded |
|---|---|---|
| Signal | State changed | For signals assigned to the events table: by default on/off and enumerated signals. Measured values are not in the event list; they are in the trends. |
| Alarm | Raised, Acknowledged, Cleared | Always |
| Command | Result | Always: who, what, the value, the result and the reason |
| System | Active, Cleared, Info | Always: communication, history, disk, scripts and other system alarms |
| Operator | Page opened, Opened popup, Login, Logout, Area control, Operating mode, Confirmation, Communication control, Interlock overridden, Interlock override refused, Switching program, Tag placed, Tag removed, Note added, Note removed, Project phase, Licence | Always |
Events are kept for 1825 days (five years) by default; see How history is recorded. If the history database is not reachable, events wait in a buffer of up to 1 GB.
Good to know
- The list loads 200 rows at a time. Load more reads further back, up to 5,000 rows. At that point it shows Display limit — narrow the filter.
- Download Excel writes the rows that match the filters with the visible columns, as
olay-listesi.xlsx. See Export data. - Your columns, filters, sort order and search are kept for your user and this list. With user login they follow you to other stations.
- On the object, the scope switches choose what the list can show: Signal events, Alarm, Command, System, Operator and Page transitions. Event table chooses another events table. See List objects.