Trend and Trend Table objects
The Trend object puts a complete trend on a page: the pens you choose in the design, a toolbar, a date-time bar, a legend, a value table and a status bar. The Trend Table object shows the same values as rows of a table.
Before you begin
- The page is open in the screen editor.
- The signals are recorded in an archive table; see Archive tables and assignments. Both objects read the history and add the live values as they arrive.
Steps
1. Place a trend
In WIDGETS, click Trend and draw a rectangle on the page. PROPERTIES shows the groups DATA, TIME, APPEARANCE and RUN. In the editor the object does not respond to the mouse; its buttons work on the run screen.
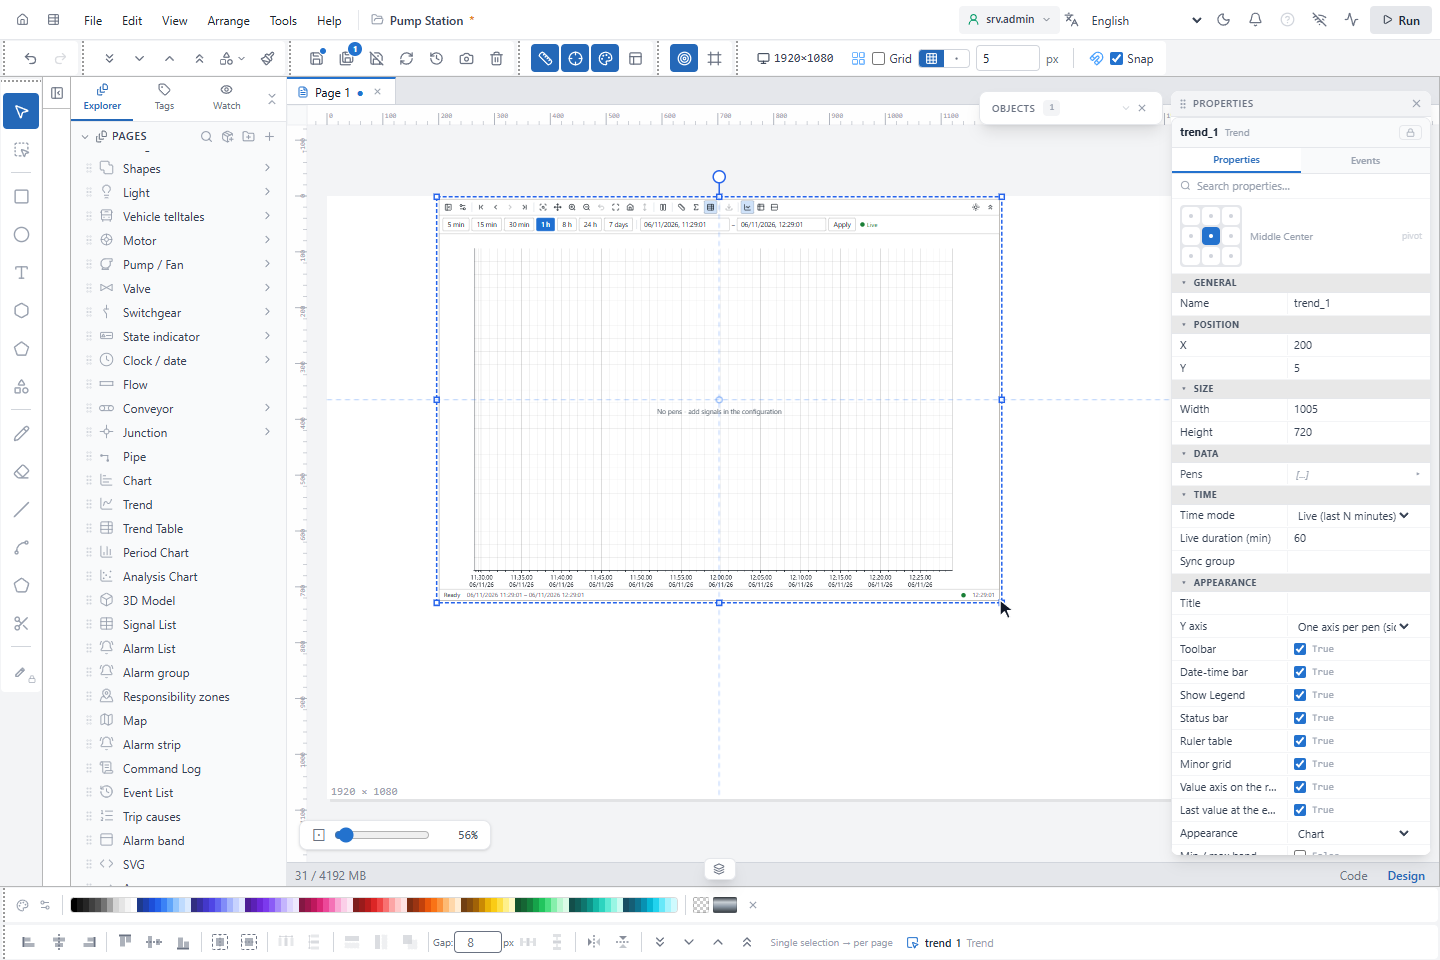
All fields with their defaults are listed in Trend.
2. Add the pens
Expand Pens and click + Add pen for each signal. Click — select tag — to choose the signal in the signal picker.
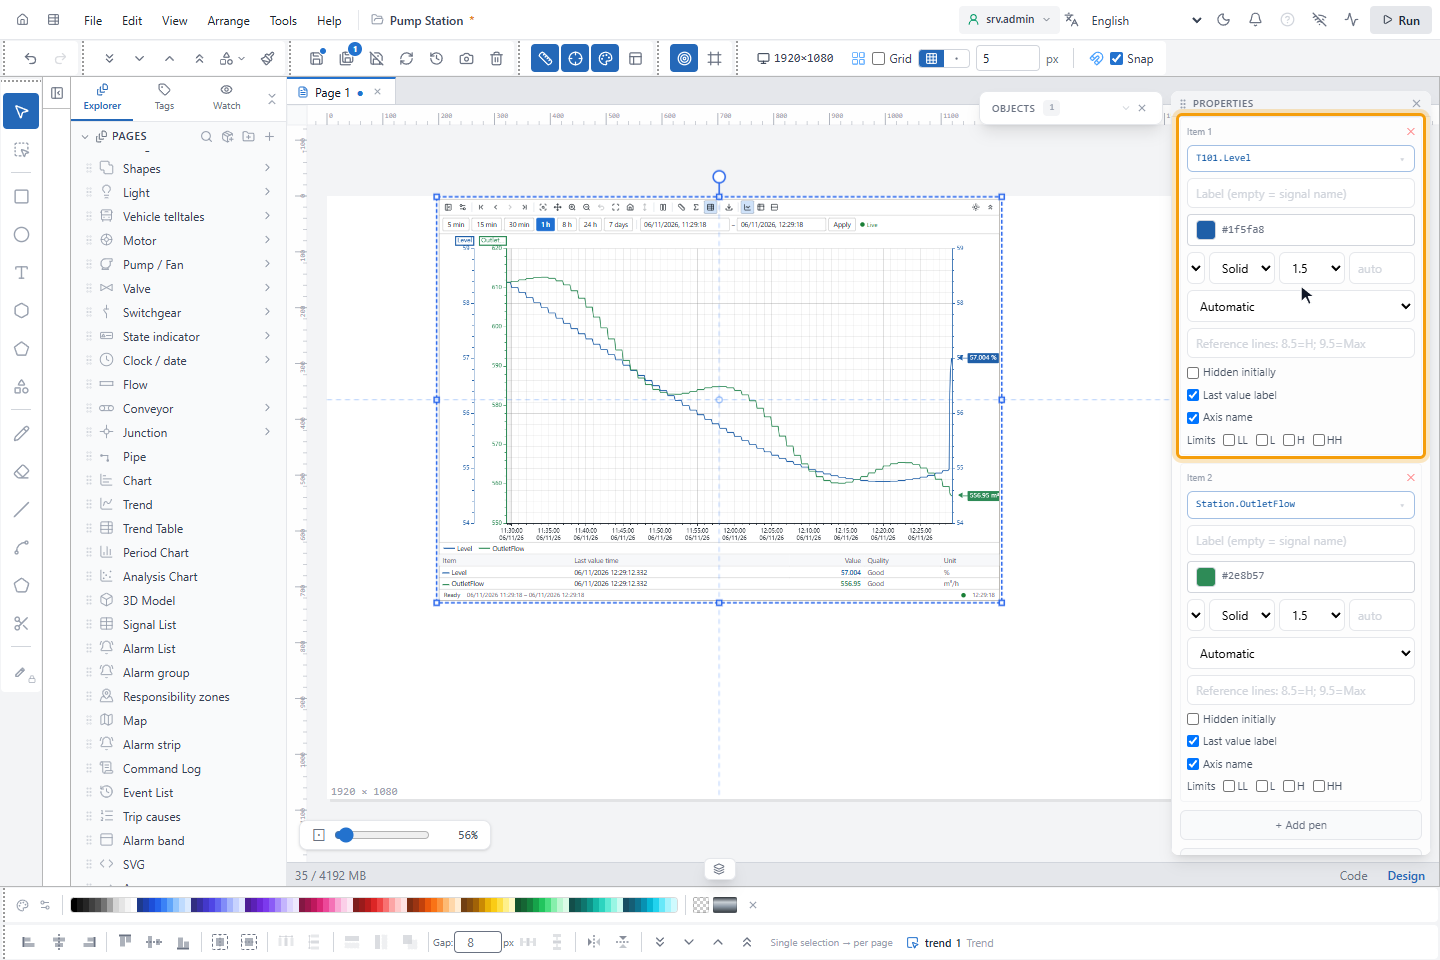
| Field | Meaning |
|---|---|
| Label (empty = signal name) | The name in the legend and in the tables |
| Color | The color of the line |
| Plot | Linear, Stepped or Points |
| Text Decoration | The line type: Solid, Dashed or Dotted |
| Width | 1, 1.5, 2, 3 or 4 |
| Decimal | Decimals of the value, 0 to 10. Empty is automatic. |
| Y scale | Automatic from the data, or Manual with Minimum and Maximum |
| Hidden initially | The pen is in the legend, but its line is off when the page opens |
| Last value label | The label with the last value at the end of the line |
| Axis name | The signal name above its value axis |
3. Add reference lines, limits and a fixed value
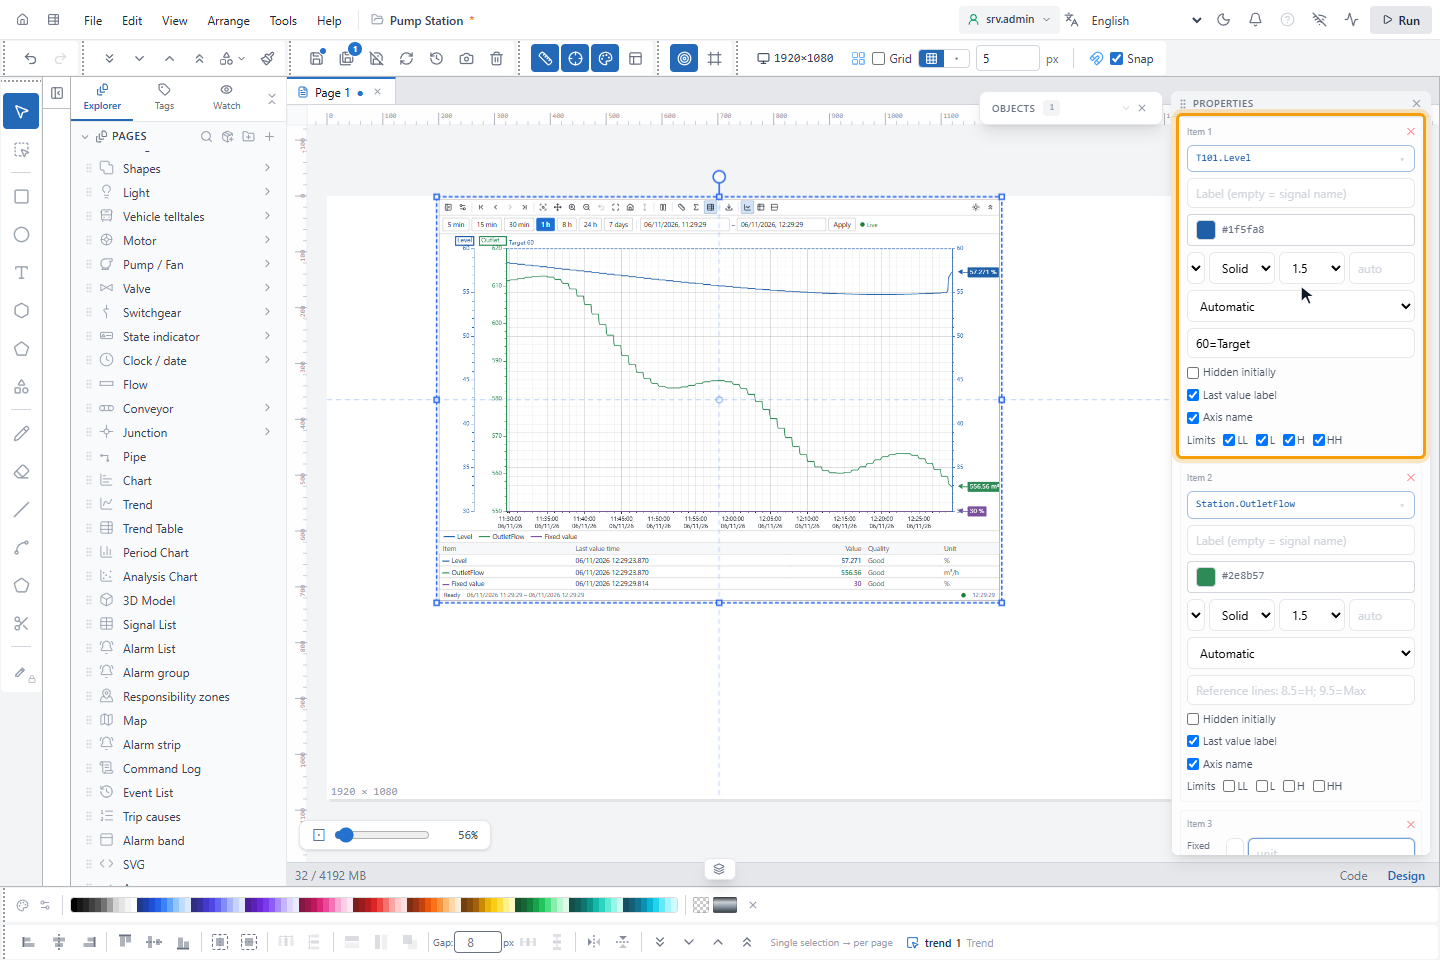
Each pen can carry three kinds of horizontal line:
| Line | How to add it | How it looks |
|---|---|---|
| Reference line | In Reference lines: 8.5=H; 9.5=Max, type value=label, several separated by ; | Dashed, with its label and value. It is always drawn. |
| Alarm limit | Under Limits, tick LL, L, H or HH | Dotted, with its level and value. Parts of the line beyond the limit are red. |
| Fixed value | Click + Add fixed value and type the value and the unit | A separate pen on the axis of the first signal, with its own entry in the legend and the tables |
The alarm limits come from the alarm levels of the signal. YTCC names them by their value: the nearest high limit is H, the next one HH, the nearest low limit L, the next one LL. Alarm limits under APPEARANCE turns all limit lines on or off. With a Manual scale, a line outside the scale is not drawn.
4. Set the time and the appearance
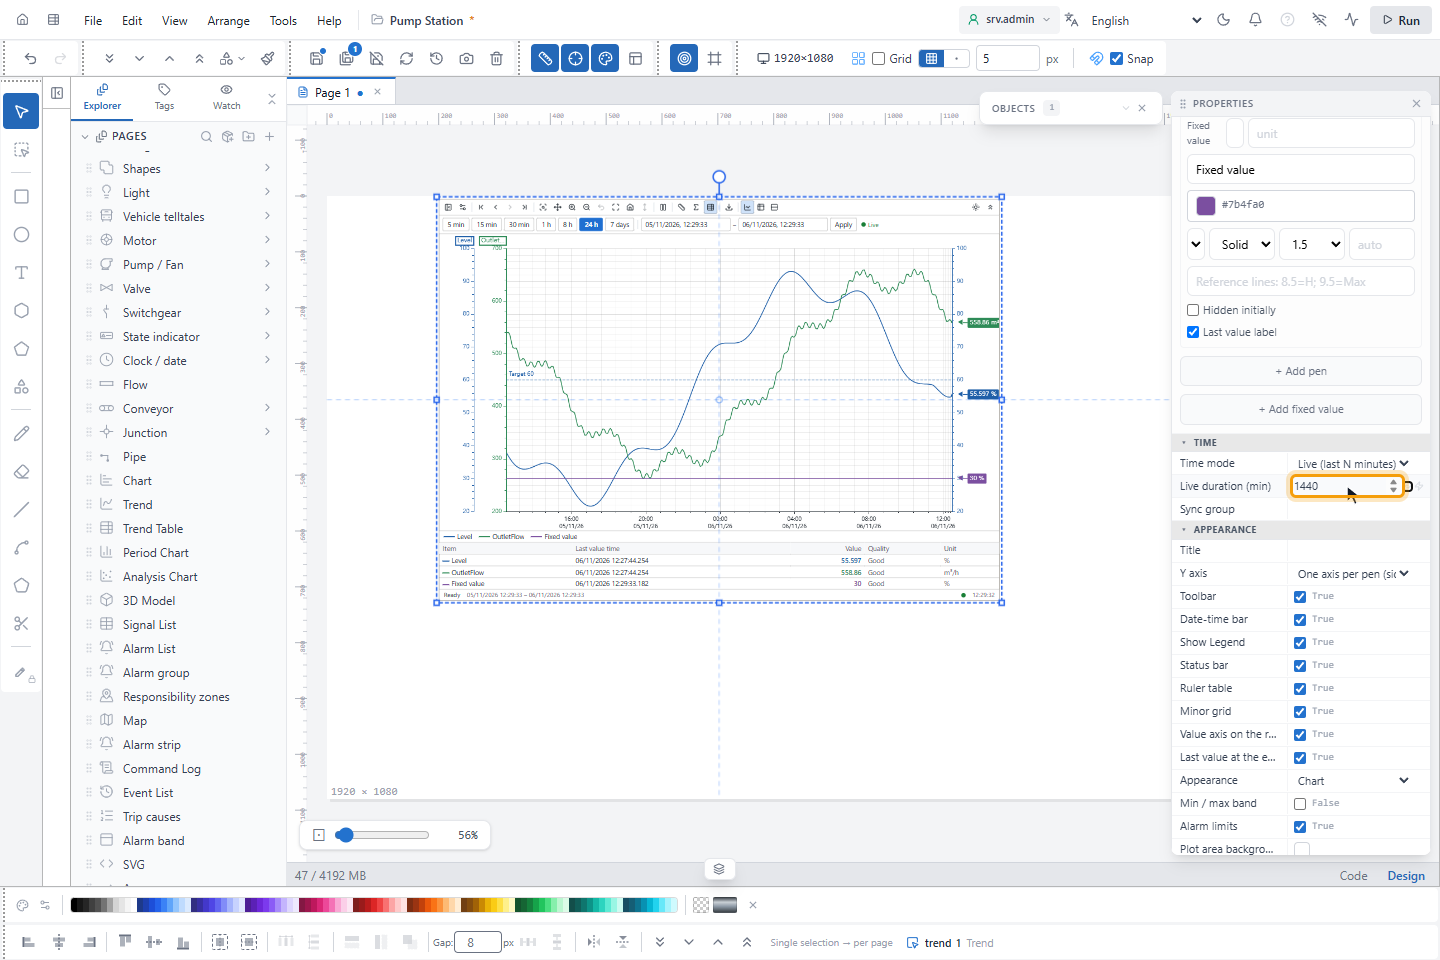
Under TIME, Time mode is Live (last N minutes) with Live duration (min), or Fixed range with Start and End. Trends and tables with the same Sync group share the time range, the pens and the ruler.
| Under APPEARANCE | Effect |
|---|---|
| Y axis | One axis per pen (side by side) or One axis per unit |
| Toolbar, Date-time bar, Show Legend, Status bar | Show or hide these parts |
| Ruler table | Opens the value table when the page opens |
| Minor grid | Finer grid lines |
| Value axis on the right too | A copy of the first axis on the right side |
| Last value at the end of the line | The labels of step 2 for the whole object |
| Appearance | Starts as Chart, Table or Chart and table stacked. Table ratio (stacked) is the share of the table, 0.2 to 0.8. |
| Min / max band | Shaded band with the lowest and highest value of each interval |
| Plot area background, Grid color | Empty follows the theme |
Under RUN, Pen editing at runtime lets the operator add and remove pens and change their color and scale.
5. Read the trend on the run screen
Save the page and open it on the run screen. The chart shows the history of the range and follows the live values. Click an entry in the legend to hide or show its line.
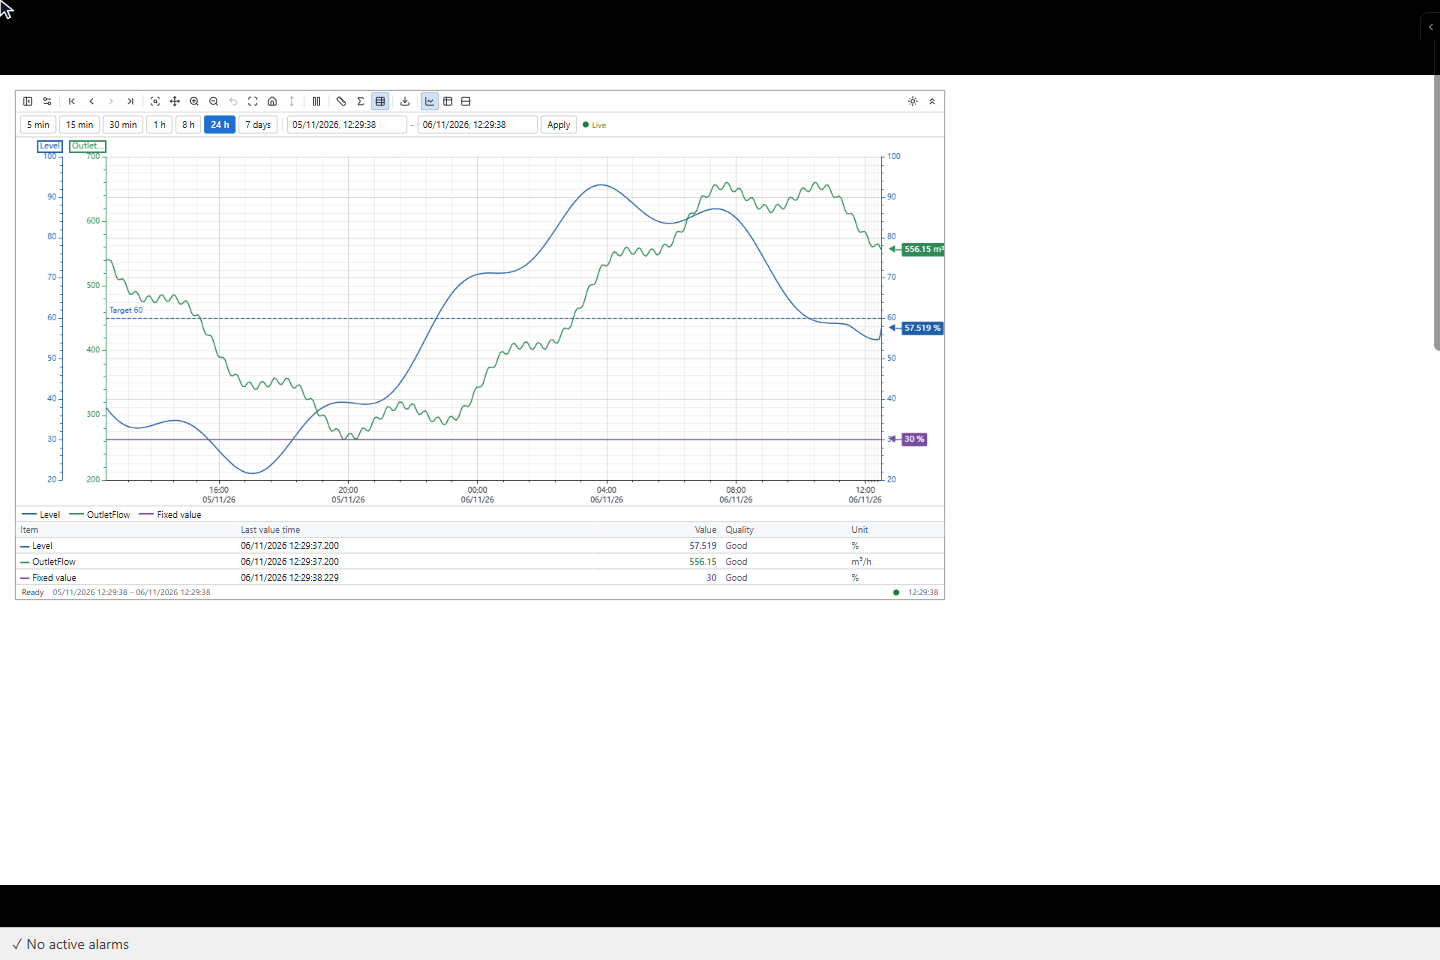
| Toolbar button | Effect |
|---|---|
| Y axis | The axis menu, see step 8 |
| Configuration | The configuration window, see step 9 |
| First data | Jumps 30 days back, with the same range length |
| Previous range, Next range | Moves by one range. Next range is off while the trend is live. |
| Latest data | Back to now, live |
| Zoom to area | Drag over the chart to zoom into that area |
| Pan | Drag the chart to move in time. Dragging works in the normal mode too. |
| Zoom in, Zoom out | Halves or doubles the range |
| Undo zoom | One zoom back. Backspace does the same. |
| Original view | The time range of the design |
| Default view | Time range, zoom, ruler, statistics, axis layout, view and value table as in the design. The pens stay. |
| Reset vertical scale | See step 7 |
| Stop, Start | Stop freezes the display while recording continues. Start returns to now. |
| Ruler, Statistics area, Value table | See step 10 |
| Export | See step 13 |
| Chart, Table, Chart and table stacked | See step 11 |
| White background, Hide top bars | See step 12 |
The status bar shows Ready, Loading…, Stopped, Historian (a fixed range) or Data could not be retrieved with the number of pens. It also shows the range, the connection dot and the clock. The chart marks a value of uncertain quality with ▲ and of bad quality with ◆.
6. Move in time
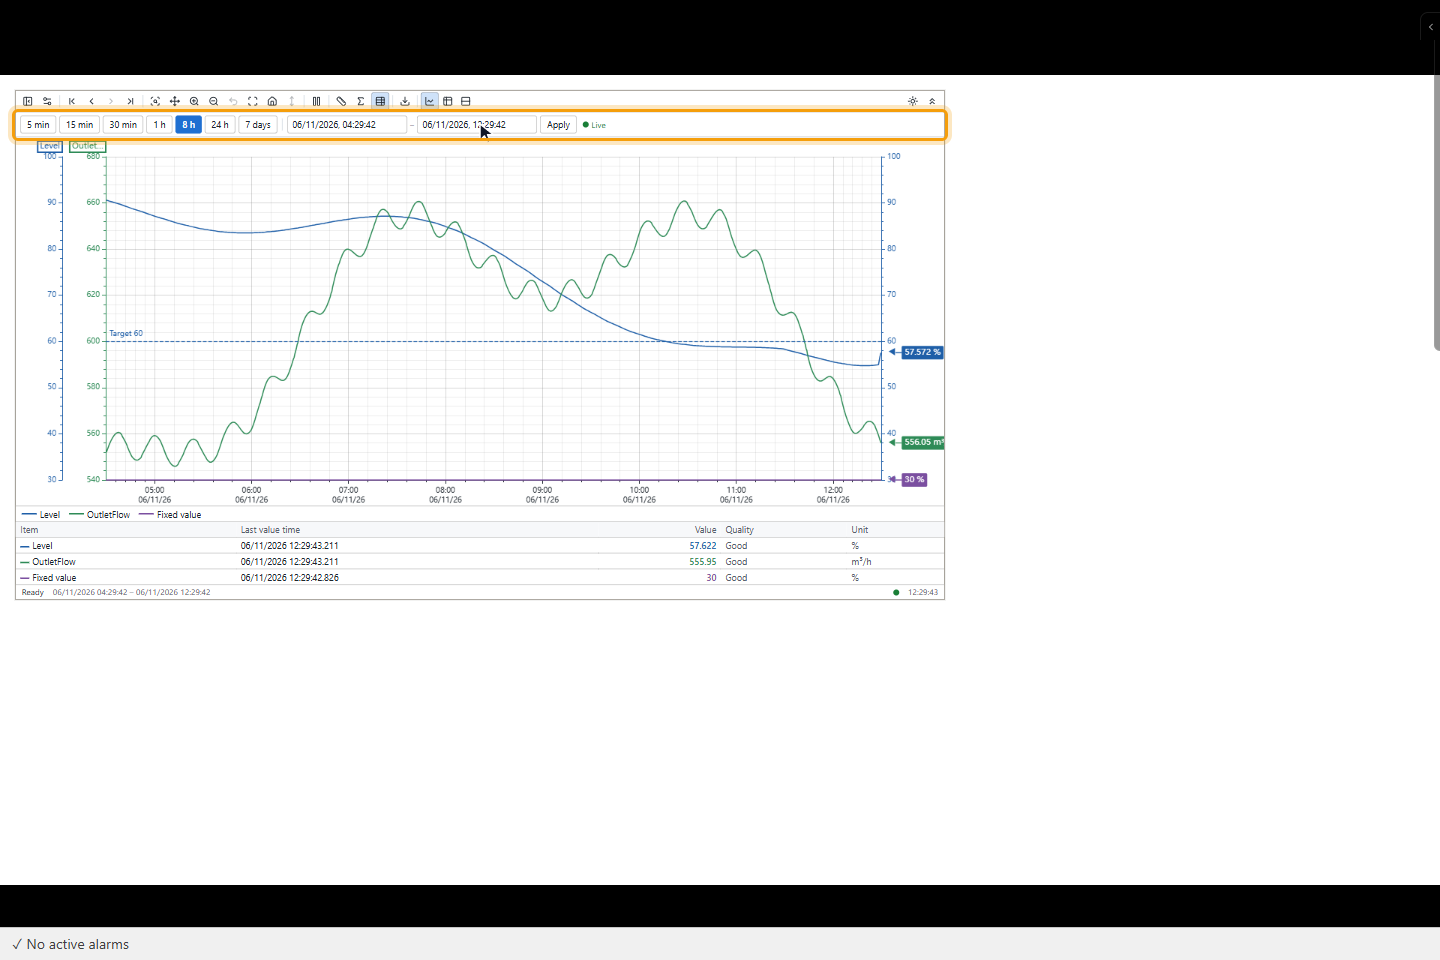
The date-time bar has the live ranges 5 min, 15 min, 30 min, 1 h, 8 h, 24 h and 7 days. To show a fixed range, change Start and End and click Apply or press Enter. The fields use the date format of the interface language and turn red when the text is not a valid date. The indicator at the end shows Live, Stopped or Historian.
The mouse wheel over the chart zooms in time. Zooming or dragging leaves the live mode; Latest data or Start goes back.
7. Move and scale the vertical axis
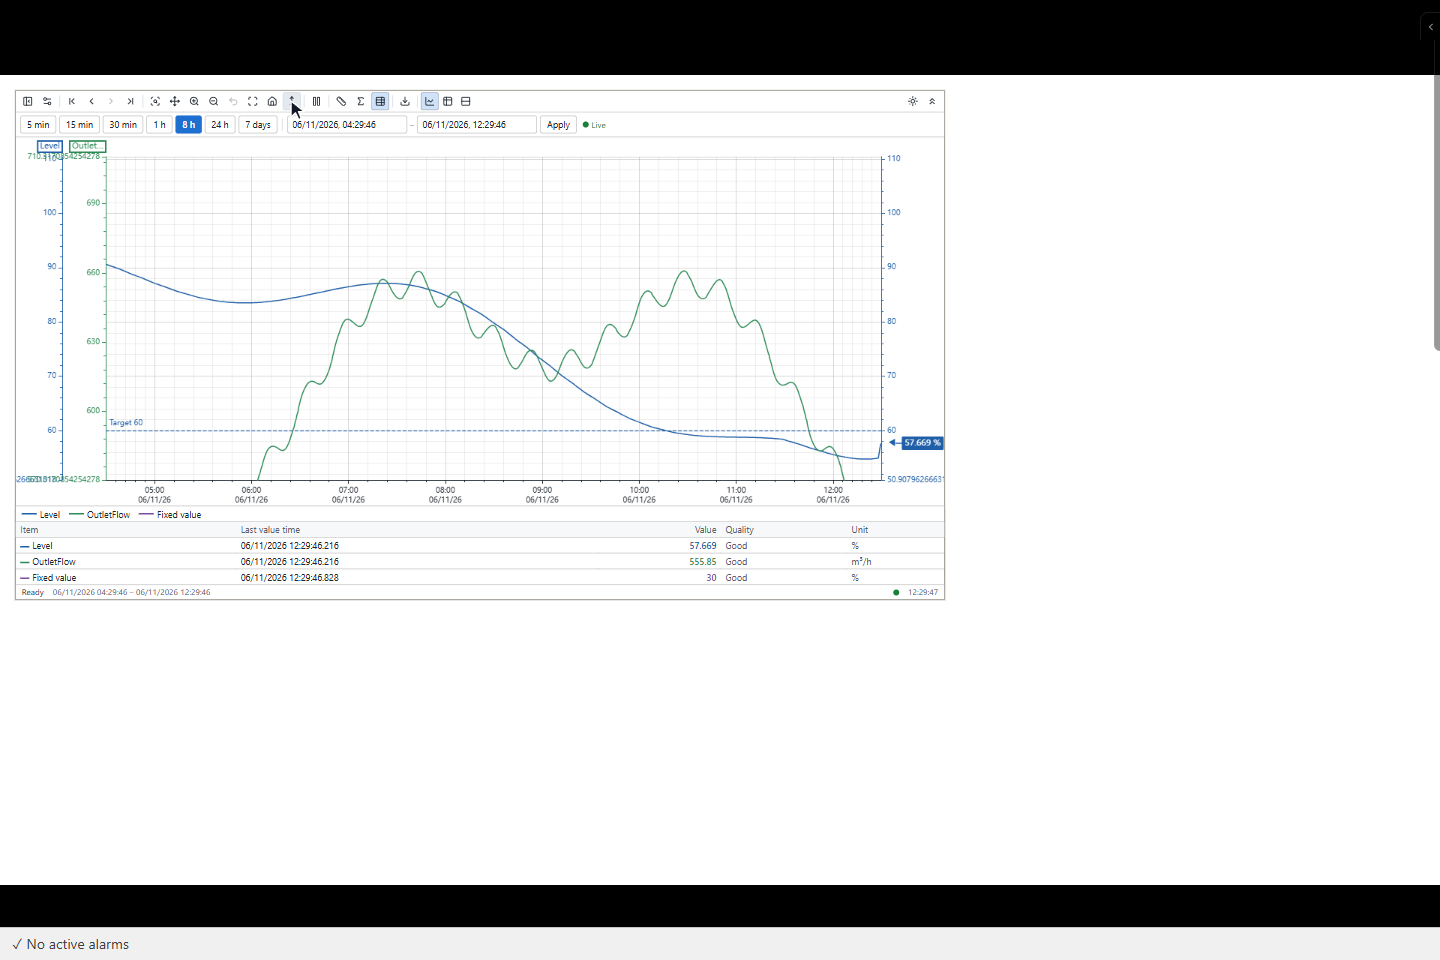
| To | Do this |
|---|---|
| Move all axes | Drag the chart up or down |
| Move one axis | Drag on that axis |
| Scale one axis | Turn the wheel on that axis. The value under the mouse stays in place. |
| Move or scale all axes | Do the same on the axis on the right |
Reset vertical scale is active after such a change and restores the scale. Changing the axis layout or the number of pens restores it too.
8. Use the axis menu
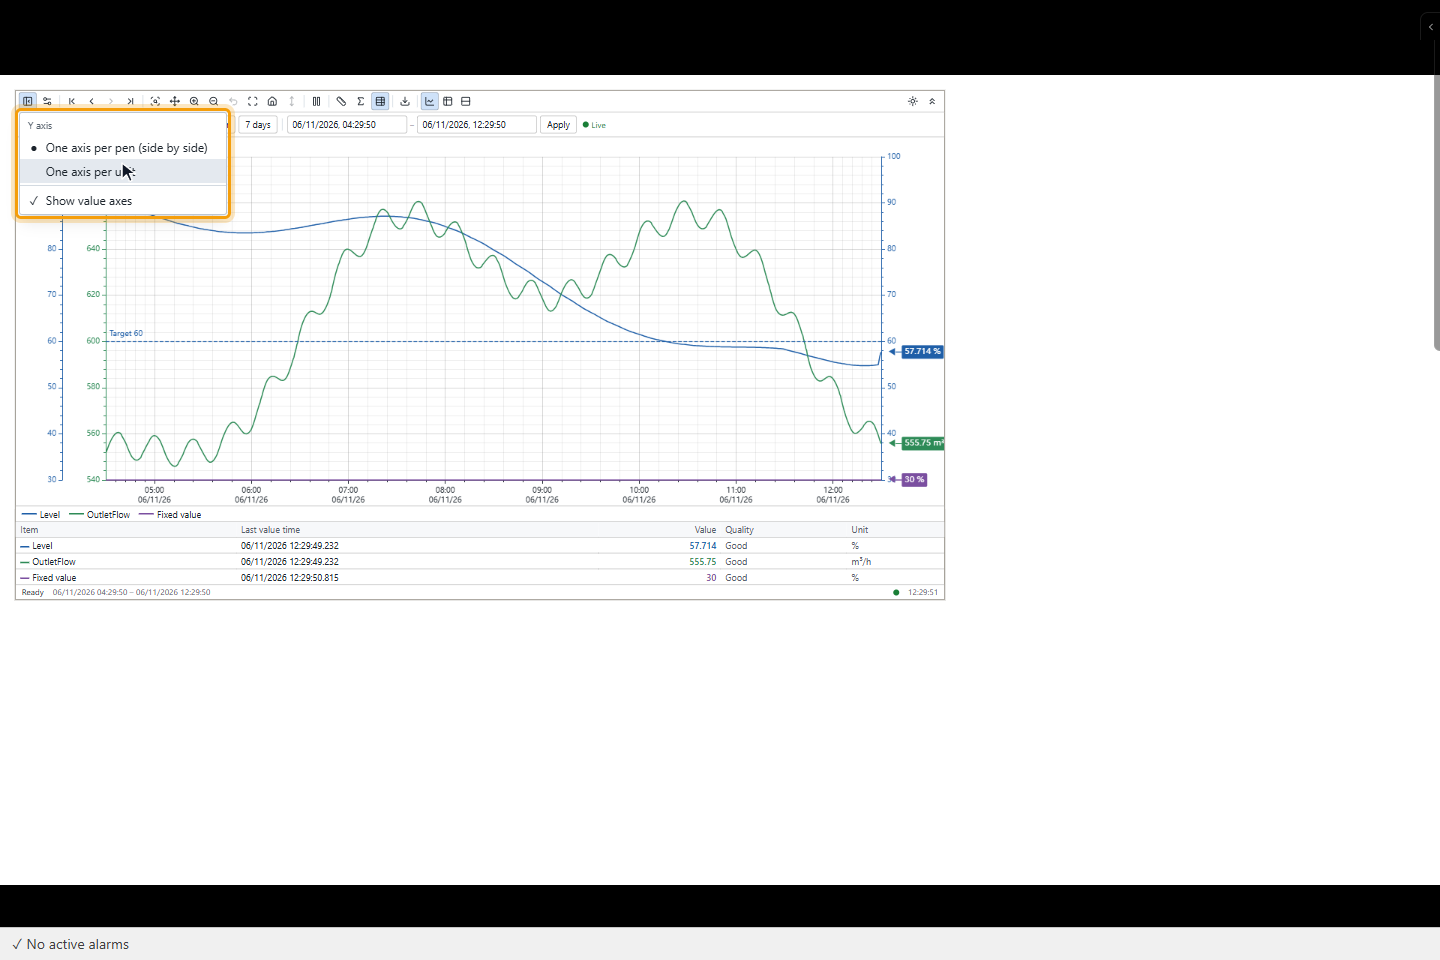
Click Y axis in the toolbar. One axis per pen (side by side) gives each pen its own axis on the left, One axis per unit puts pens with the same unit on one axis, and Show value axes hides or shows the axes for a wider chart.
9. Change the pens in the configuration window
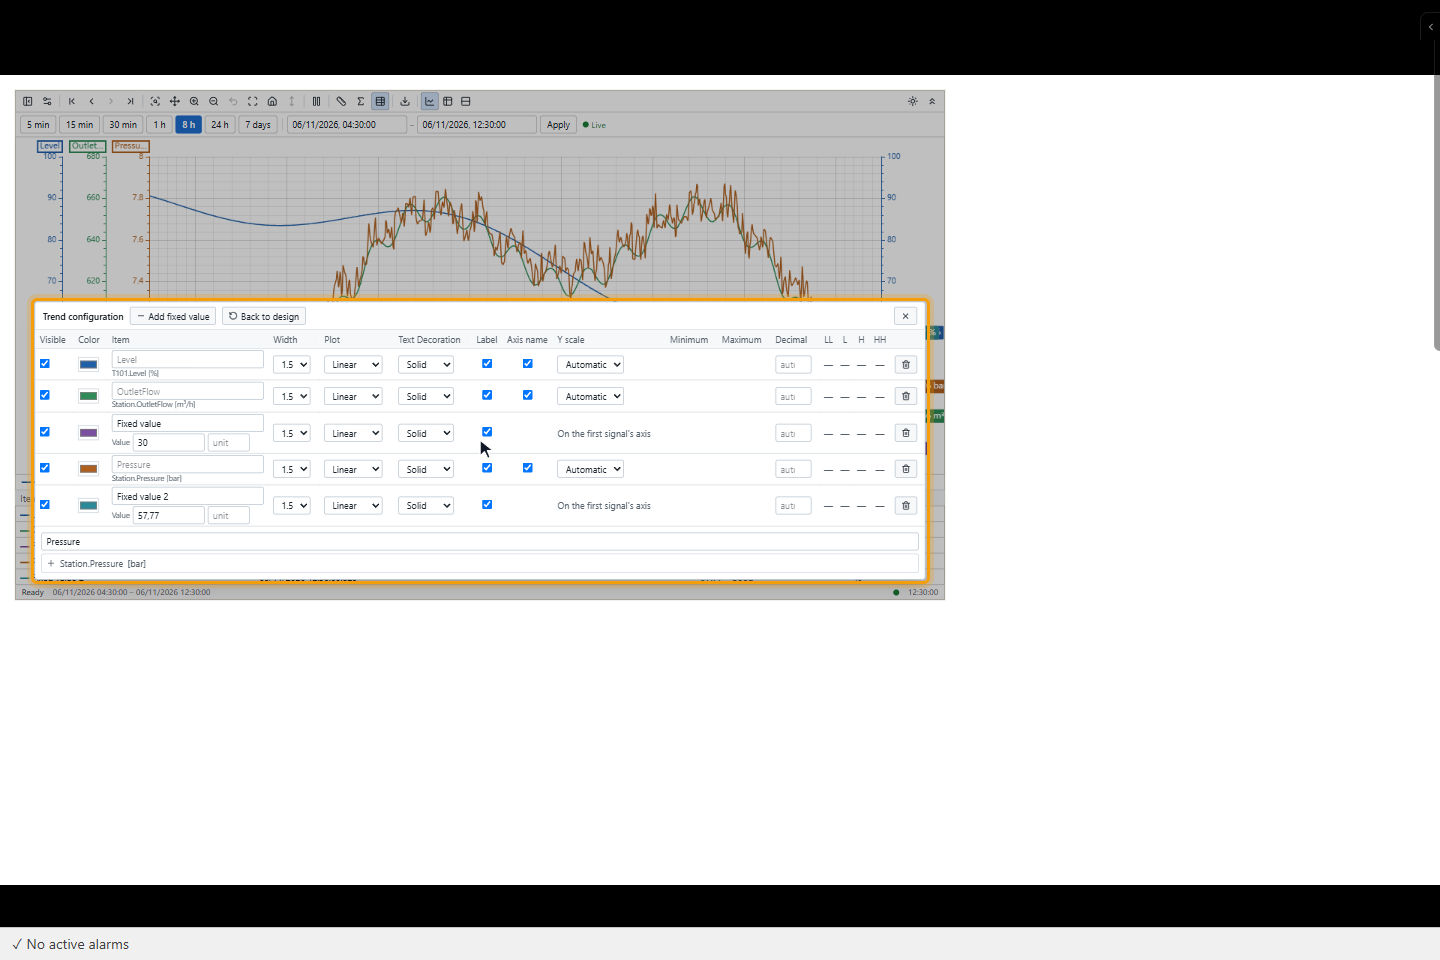
Click Configuration. The Trend configuration window opens over the object. Drag its title to move it so that the chart stays visible; a click outside the window closes it. Each pen has a row, and a change applies at once:
| Column | Content |
|---|---|
| Visible, Color | Show or hide the line, its color |
| Item | The name of the pen; for a fixed value the value and the unit |
| Width, Plot, Text Decoration | As in step 2 |
| Label | The last value label |
| Axis name | The signal name above the axis |
| Y scale, Minimum, Maximum | Automatic or Manual with the range |
| Decimal | Decimals of the value |
| LL, L, H, HH | Shows the alarm limit on the chart. A limit the signal does not have shows a dash. |
Search in Search signal (min. 2 letters) and click a result to add a pen. The trash icon (Subtract) removes a pen. Add fixed value adds a line at the last value of the first signal. Back to design discards the changes.
The changes are kept in this browser for this object. They are discarded when the pens of the design change. With Pen editing at runtime off, the window only shows or hides pens.
10. Measure with the ruler and the statistics area
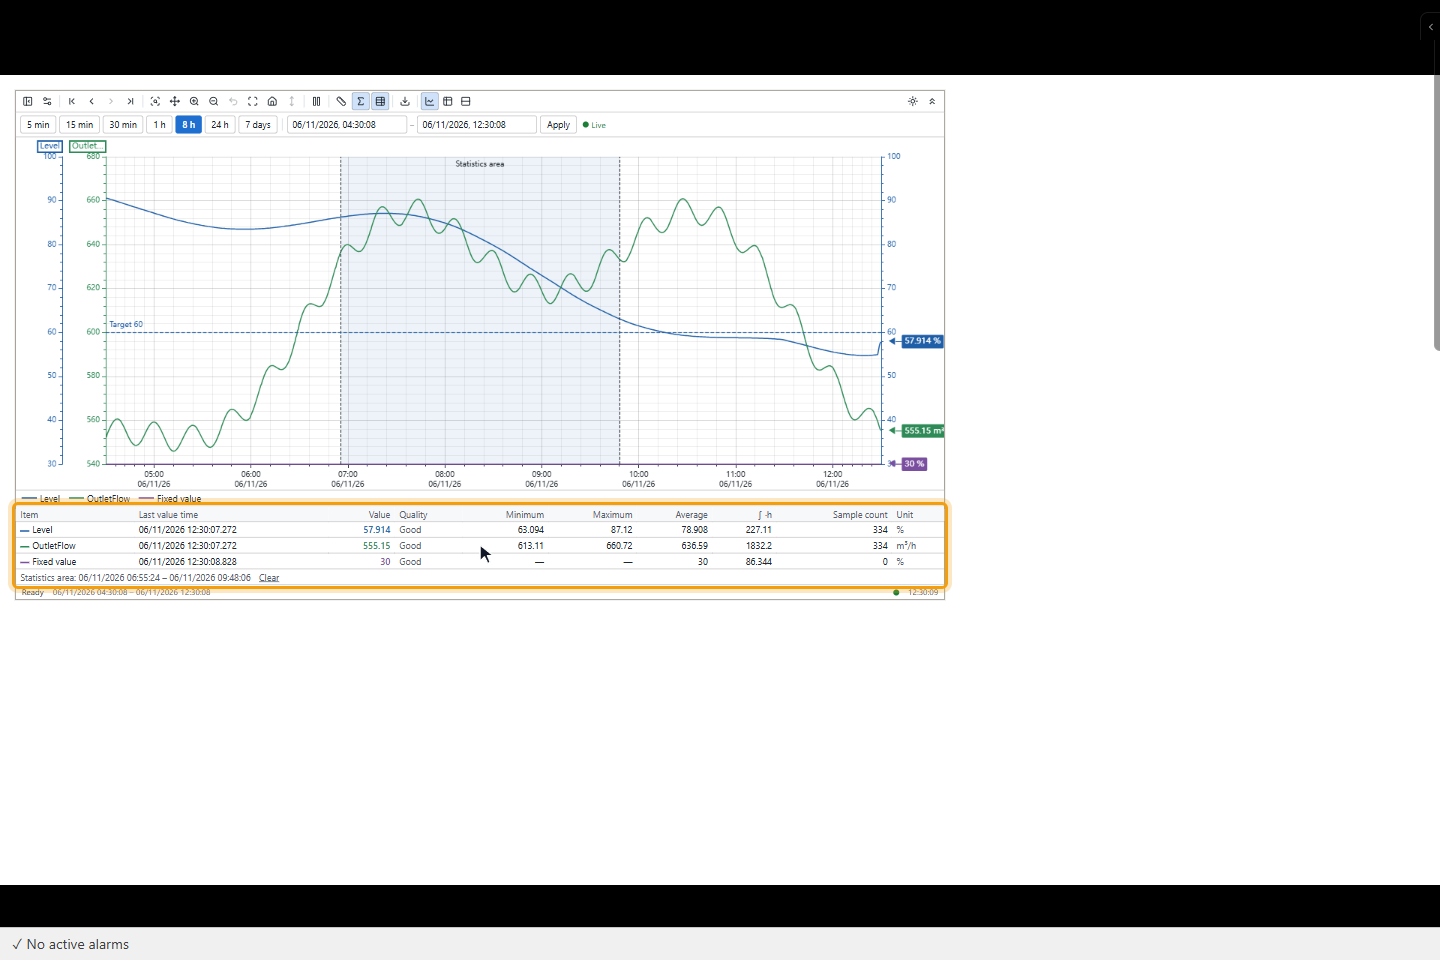
Value table opens the table under the chart. It shows Item, Last value time, Value, Quality and Unit for each pen.
With Ruler, click or drag on the chart: the column changes to Ruler time and the table shows the values at that moment. With Statistics area, click the start and then the end of an interval. The table adds Minimum, Maximum, Average, ∫ ·h (the time-weighted integral, so flow gives volume and power gives energy) and Sample count. Clear removes the area. Esc leaves these modes.
11. Switch between chart and table
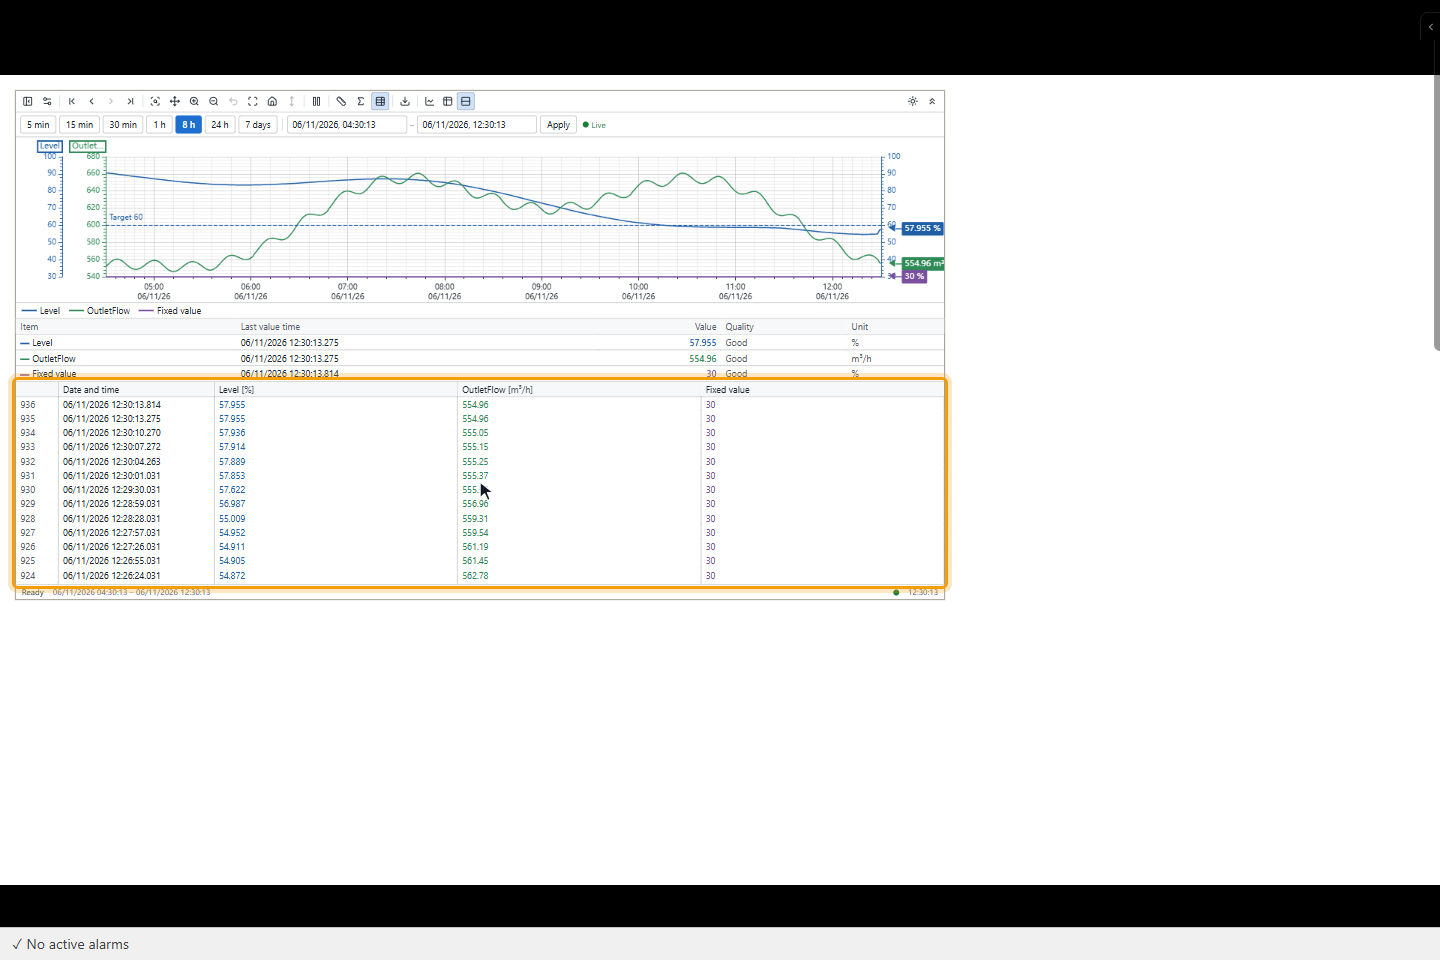
Chart, Table and Chart and table stacked show the same data and the same range. The table has one row per time with the newest row on top.
12. Hide the top bars and change the background
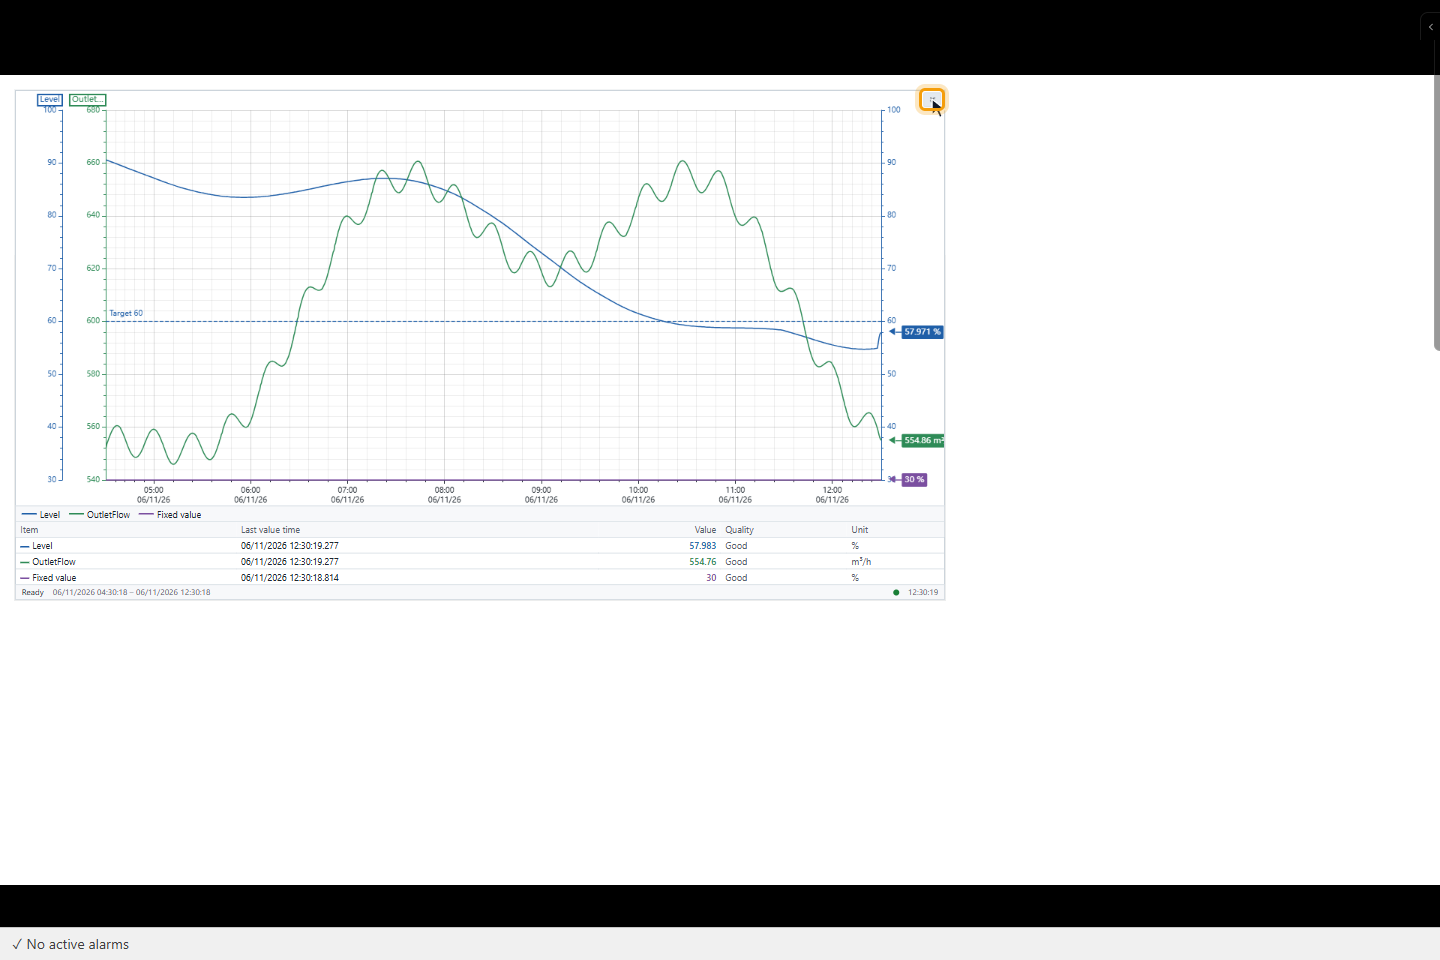
Hide top bars removes the toolbar and the date-time bar for a larger chart. The small Show top bars button at the top right of the chart brings them back.
The sun button changes the background. The object starts transparent, on the color of the screen, and the button is called White background. After a click it is white with Plot area background applied, and the button is called Screen-color background.
13. Export the data
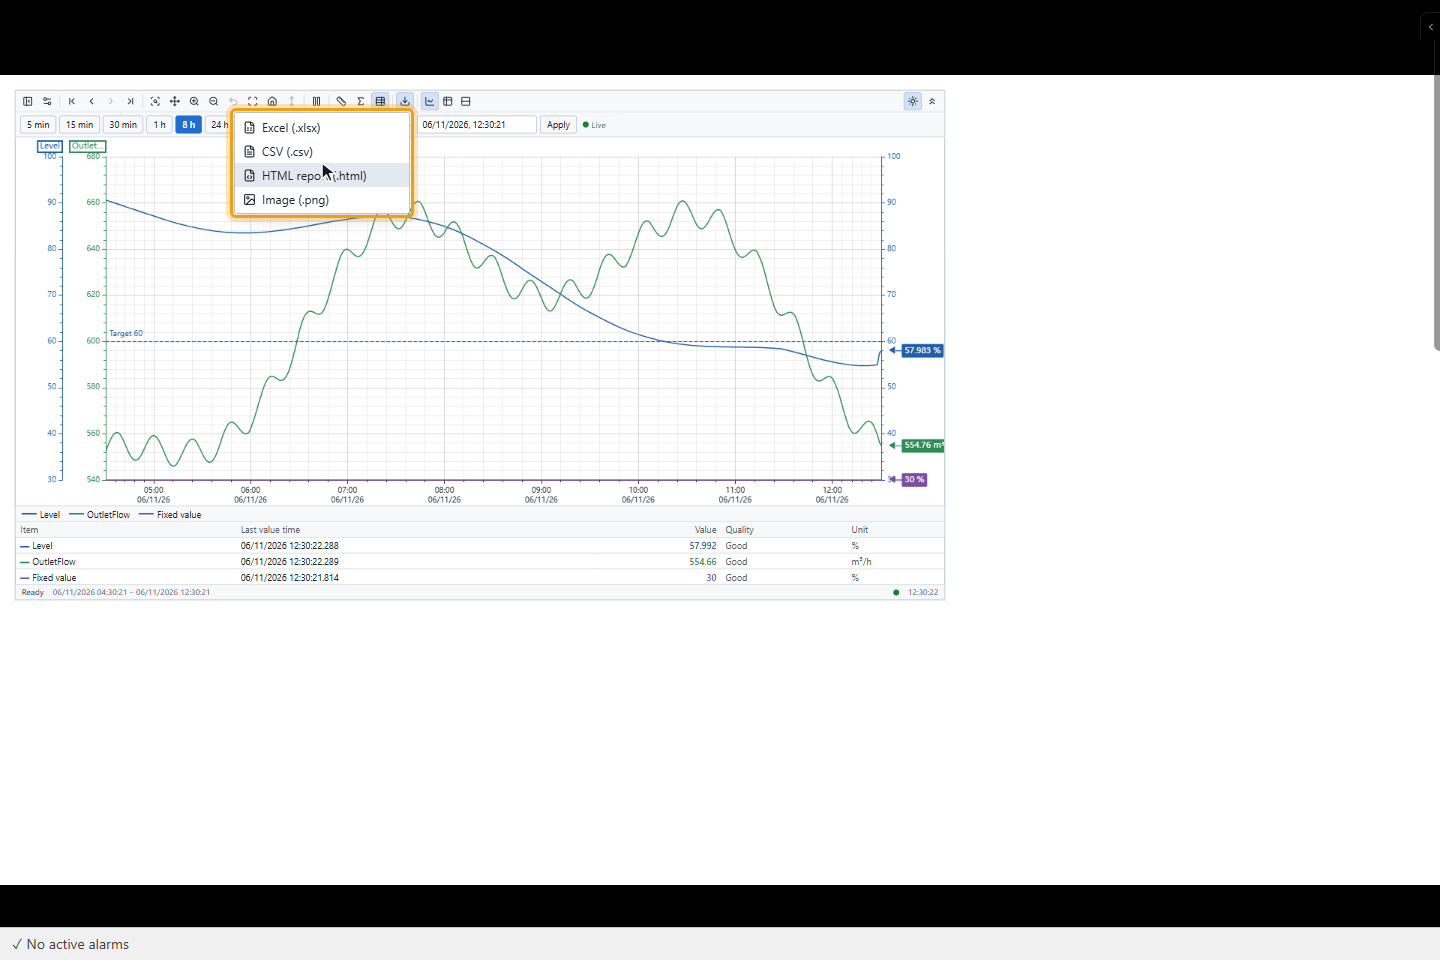
Click Export and choose Excel (.xlsx), CSV (.csv), HTML report (.html) or Image (.png). The file holds the visible range. YTCC asks where to save the file; a browser without this dialog downloads it to the download folder and a message says so.
14. Show the values in a Trend Table
In WIDGETS, click Trend Table and draw a rectangle. Add pens as in step 2, or set the same Sync group as a trend: the table then uses the pens of the trend, its time range and its ruler. All fields are listed in Trend Table.
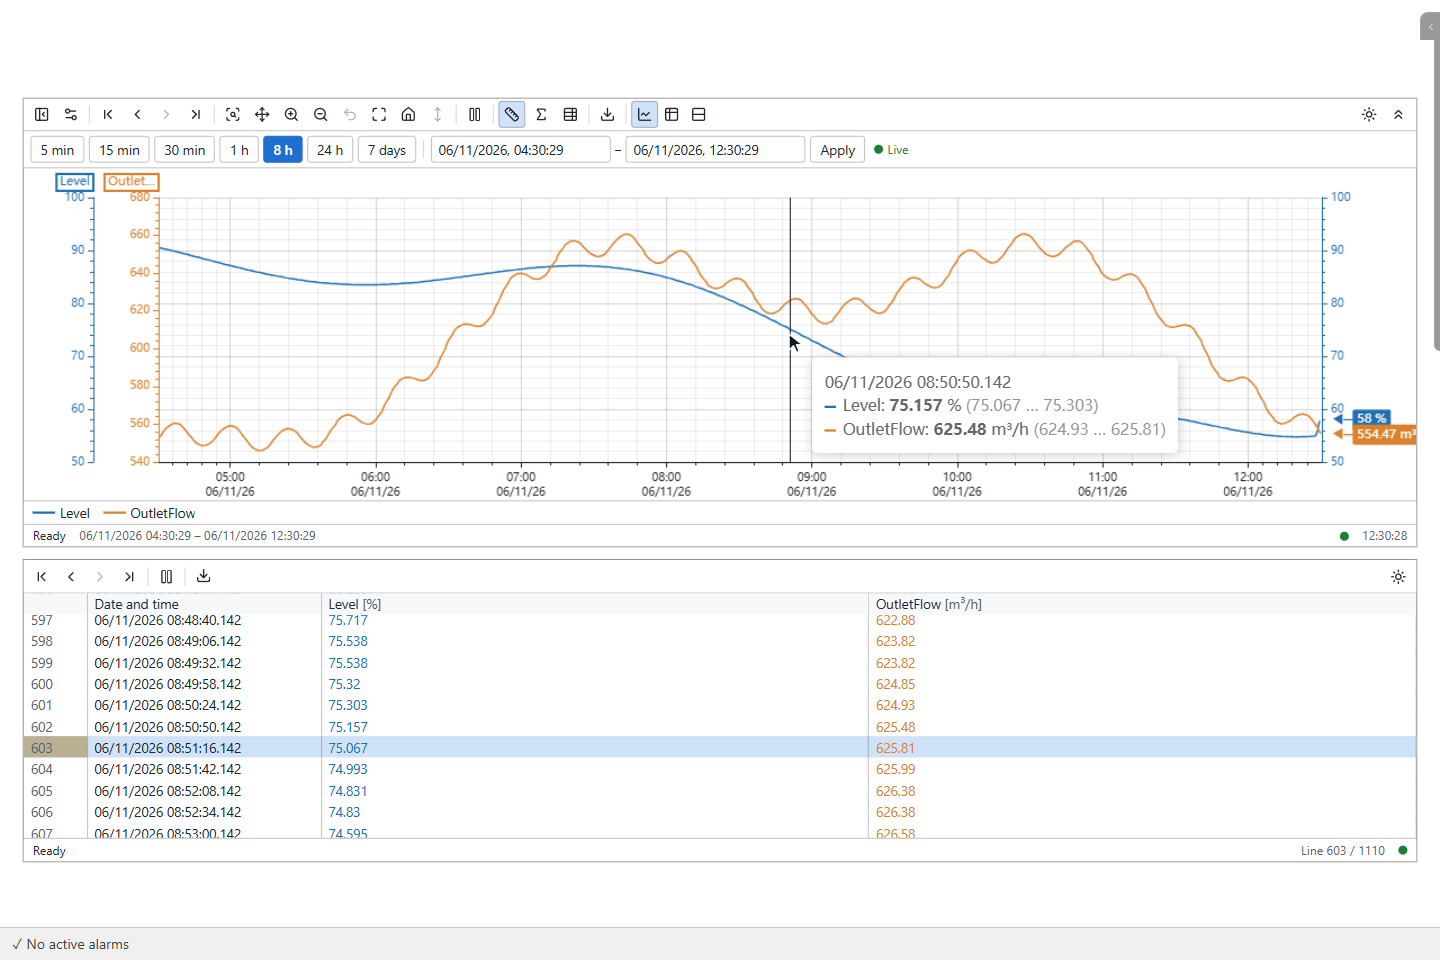
The table has a row number, Date and time with milliseconds, and a column for each pen. A value of bad quality is faded with ◆, a value of uncertain quality has ▲, and a value beyond an alarm limit of the signal is red. The table follows the newest row until you scroll away. The ruler of the trend scrolls the table to the nearest row and highlights it.
| Property | Default | Effect |
|---|---|---|
| Live duration (min) | 15 | The range in Live (last N minutes) mode |
| Font size | 12 | Text size of the table |
| Last value in empty cell | On | A cell without a sample repeats the last value of the pen |
| Newest first | Off | The newest row on top |
Its toolbar has the time buttons, Stop, Export without the image format, and the background button. The status bar shows Line with the selected row and the number of rows.
Next steps
- Chart object compares the objects and the Trend screen.
- Period and analysis charts show bars per period and statistics.
- Draw charts from the screen draws signals the operator clicks on the screen.