Watch the alarm indicators
YTCC watches two signs of a poor alarm system: an alarm flood, more alarms in a short time than an operator can handle, and chattering alarms, which come and go again and again. The alarm list shows both, so that an engineer can find the alarms to improve. How to improve them is in the Alarm philosophy guide.
Before you begin
- A screen has an Alarm List; see Put alarm objects on a screen. This page uses the example project, where two alarms come and go repeatedly within half a minute.
Steps
1. Read the alarm rate
Open the page with the alarm list on the runtime screen. In the status bar at the bottom of the list, Last 10 min: shows how many alarms came in the last 10 minutes. While more than 10 alarms came in that time, FLOOD appears next to it.
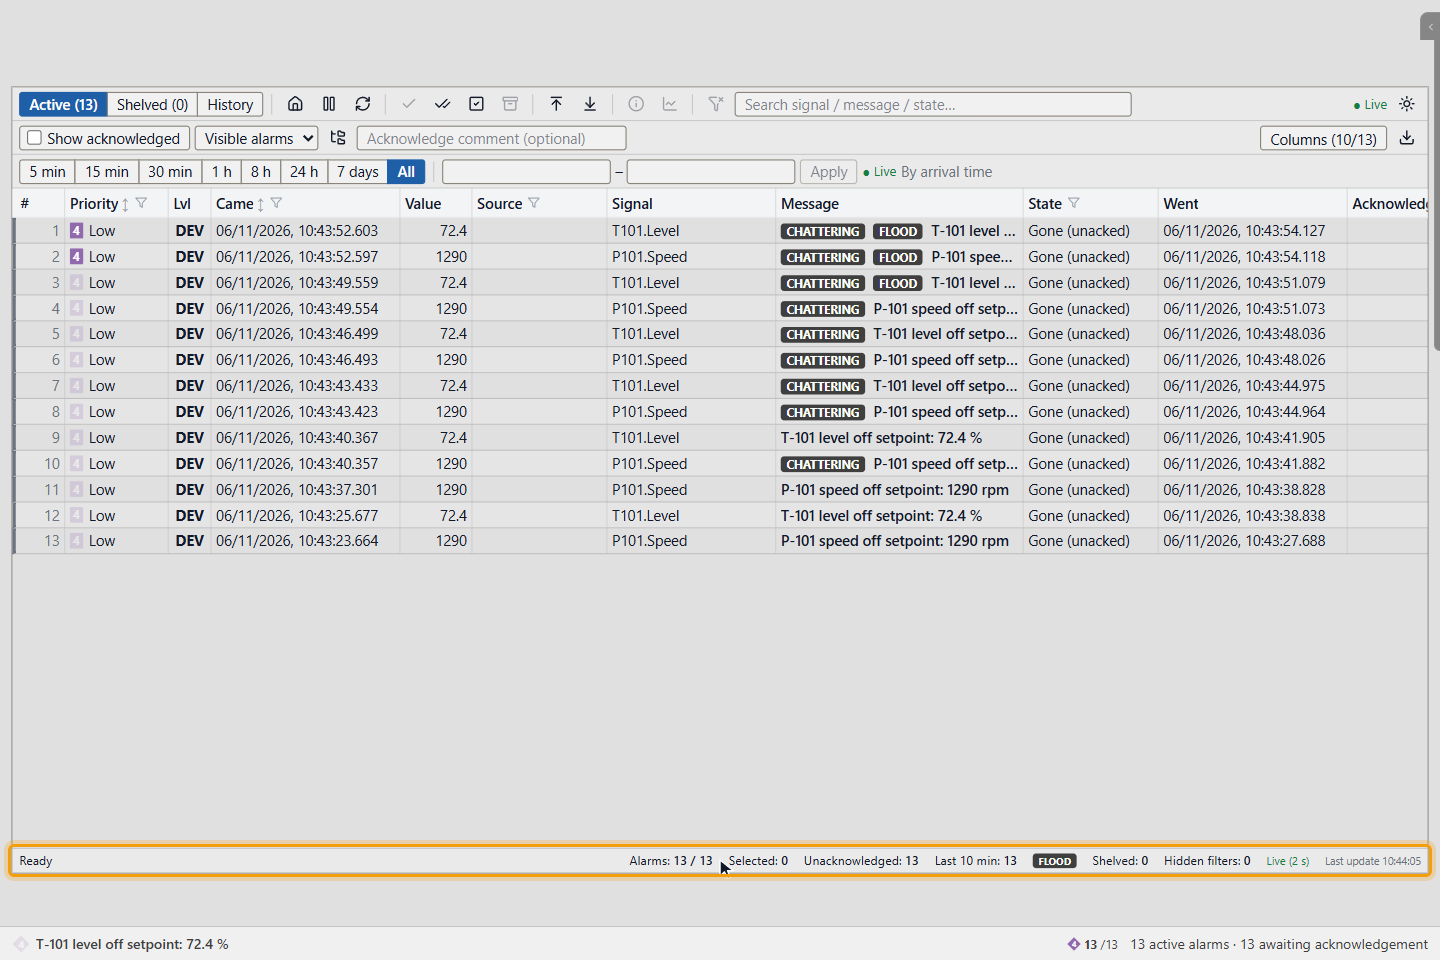
The figures are updated every 30 seconds. They count the alarms of signals; communication, command and system alarms are not counted. On a list with Status bar turned off, these figures are not shown.
2. Find chattering alarms
In the Message column, rows have badges:
| Badge | Meaning |
|---|---|
| CHATTERING | The alarm came 3 times within 60 seconds |
| FLOOD | The alarm came during an alarm flood |
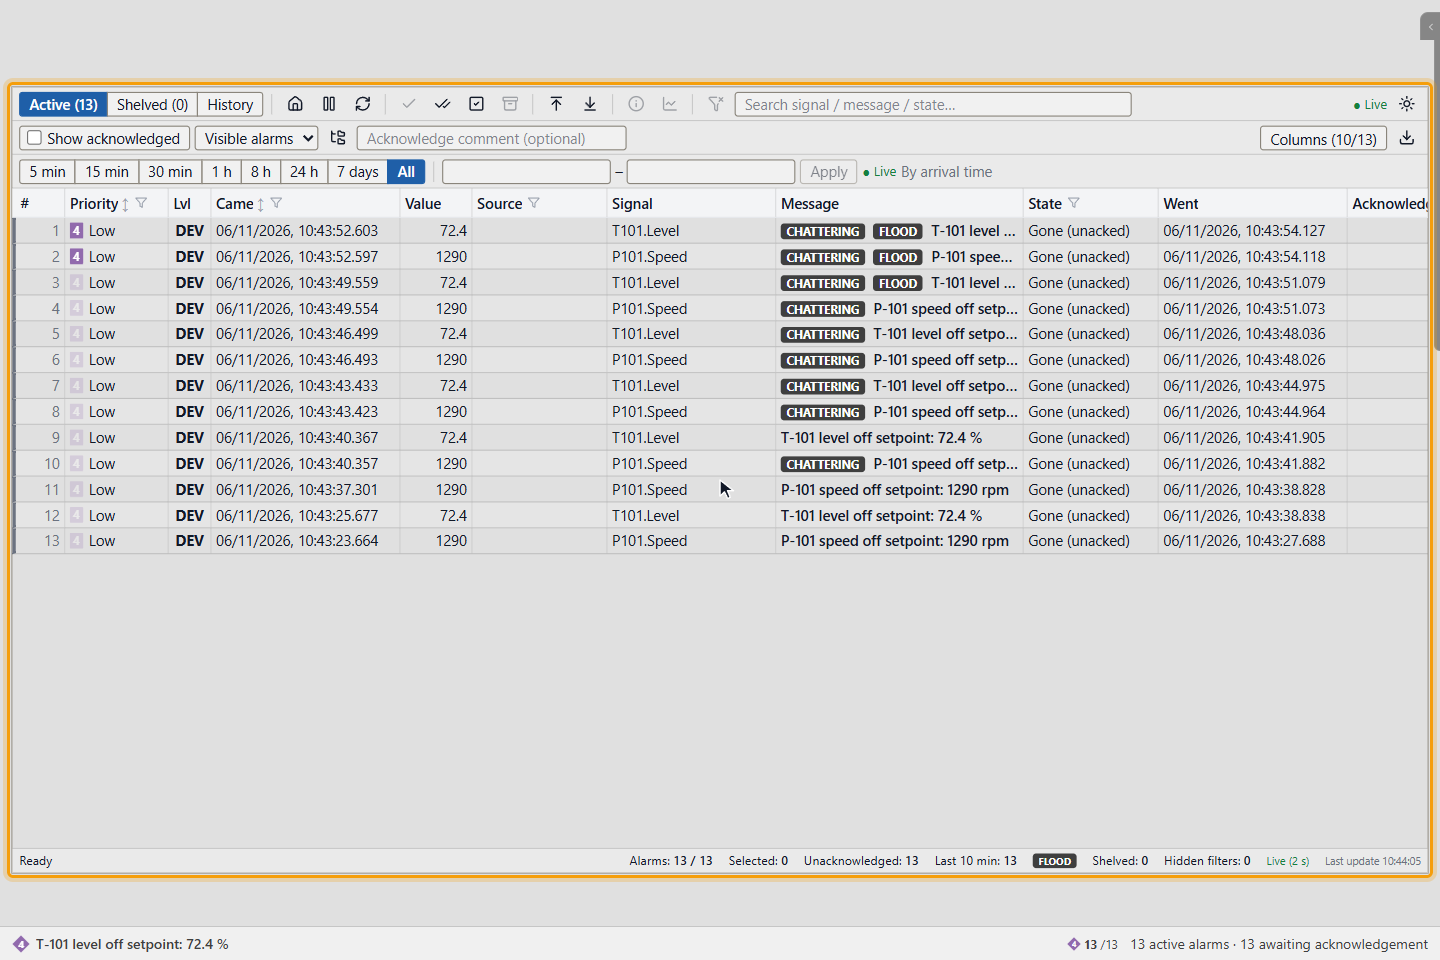
A chattering alarm is fixed in its definition with a hysteresis or an on delay; see Define alarms.
The limits
The limits are server settings of the alarm service, set as environment variables of scada-manager:
| Setting | Default | Meaning |
|---|---|---|
ALARM_FLOOD_PER_10MIN | 10 | A flood is more alarms than this in 10 minutes |
ALARM_CHATTER_COUNT | 3 | Arrivals that make an alarm chattering |
ALARM_CHATTER_WINDOW_S | 60 | The time window for chattering, in seconds |
The flood limit applies to the whole project, not to each operator position.
Good to know
- The alarm counters of the project, the areas and the groups (
Alarms.*) can be shown on screens; see Alarm classes and groups.