Chart object
The Chart object draws signals on a screen: as a line, area or bar chart over the last minutes or hours from the history, or as a gauge, pie or radar chart of the current values. For several axes, a ruler and export, use the Trend object or the Trend screen of the run screen.
Before you begin
- The page is open in the screen editor. The signals to show are recorded in an archive table; see Archive tables and assignments.
Steps
1. Place a chart
In WIDGETS, click Chart and draw a rectangle on the page. PROPERTIES shows the DATA group:
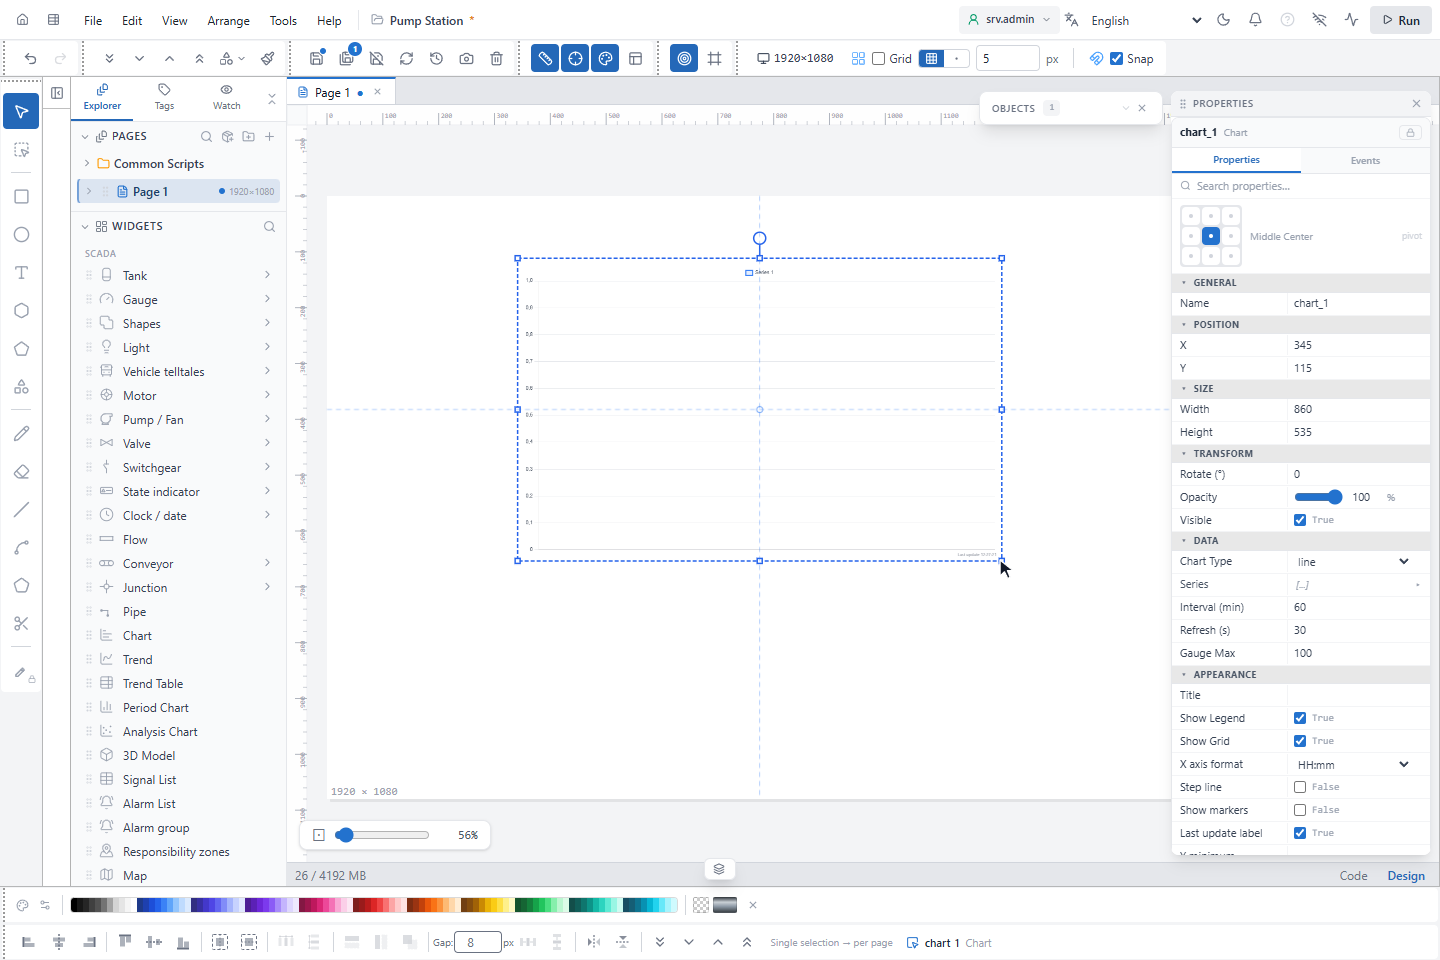
| Property | Default | Meaning |
|---|---|---|
| Chart Type | line | line, area, bar (history); doughnut (half gauge), pie, radar (current values) |
| Series | one empty series | The signals, each with a label and a color |
| Interval (min) | 60 | Time range of a history chart |
| Refresh (s) | 30 | How often the chart reads again (at least 5 s) |
| Gauge Max | 100 | Full scale of the half gauge |
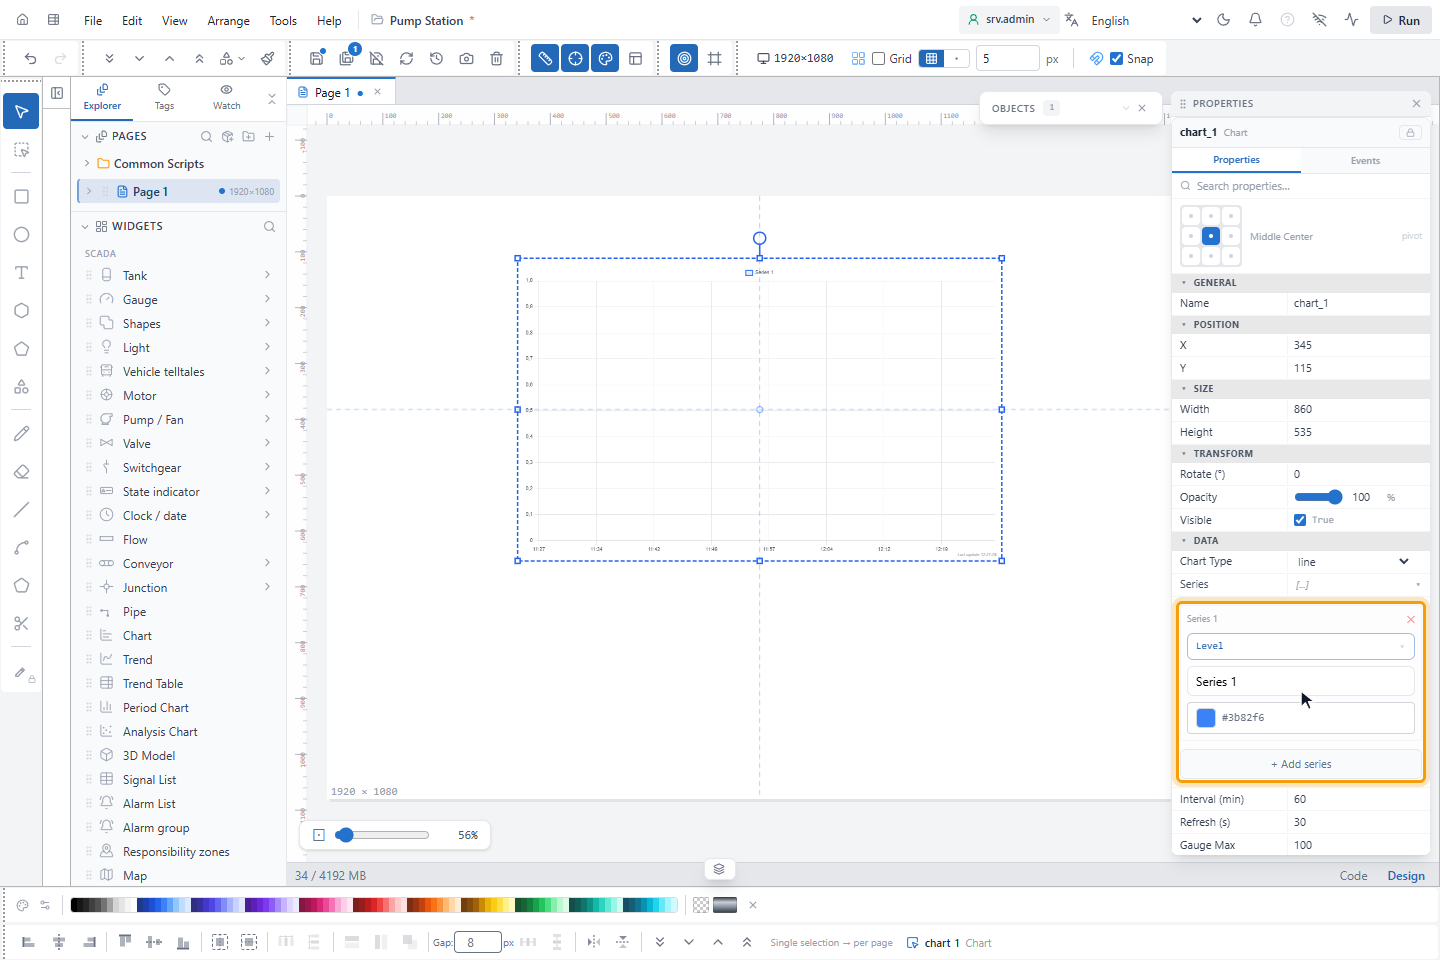
2. Choose the signals
Expand Series. Each series has a signal, a Label and a color; + Add series adds one, ✕ removes one.
Click — select tag — to choose the signal in the signal picker. A symbol can use a
parameter such as #p1# instead of a signal name. A new series gets a color that differs from the others.
3. Set the interval
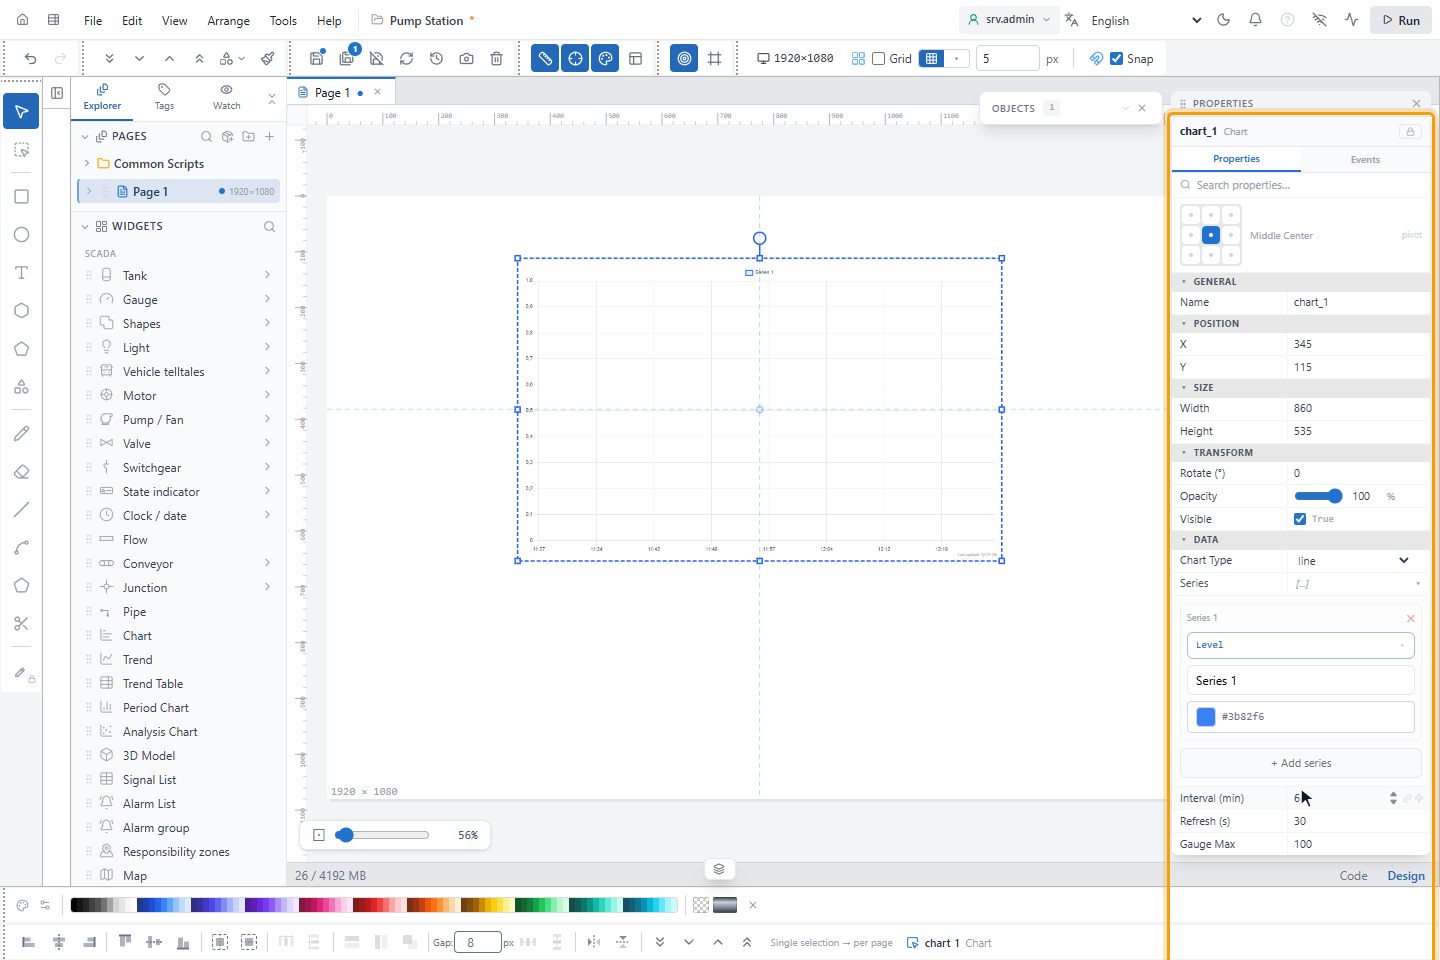
Set Interval (min) to the time range to show and Refresh (s) to how often it updates. Save the page.
4. Set the axes and the appearance (optional)
Without these settings the chart scales itself and shows the time of day. The fields are in the APPEARANCE group:
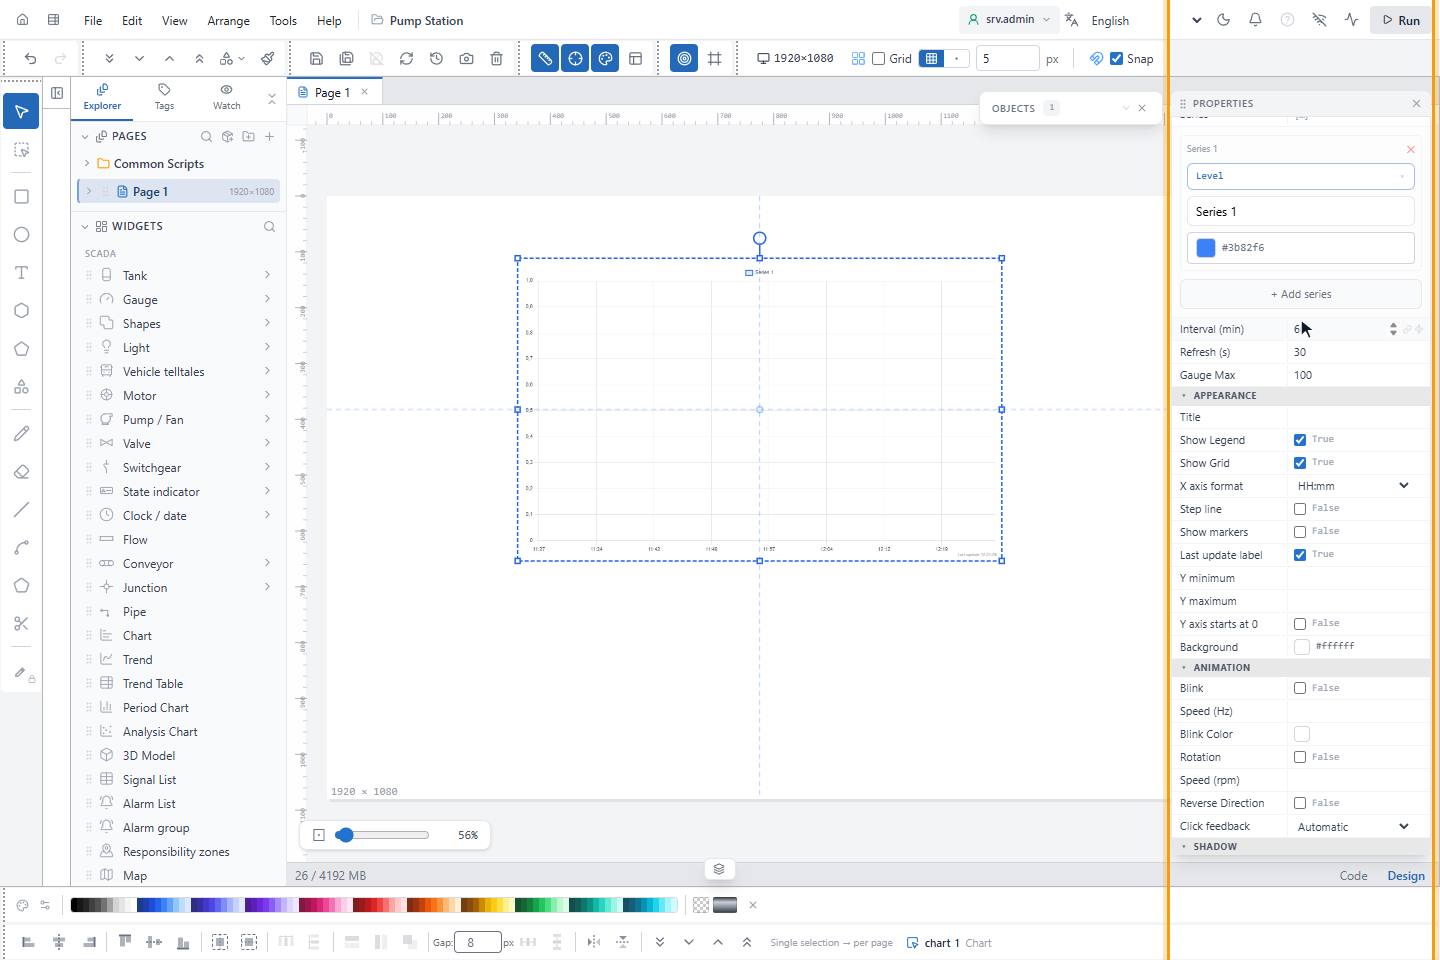
| Property | Default | Meaning |
|---|---|---|
| Title, Show Legend, Show Grid, Background | Grid and legend on | Text and grid take a light color on a dark background and a dark color on a light one |
| X axis format | HH:mm | Time axis of a history chart: HH:mm, HH, HH:mm:ss or DD.MM HH:mm |
| Step line | Off | Draws a history line in steps instead of a curve, for example for a state |
| Show markers | Off | A point on each value |
| Last update label | On | The time of the last successful reading, at the bottom right of a history chart |
| Y minimum, Y maximum | Empty | Fixed ends of the value axis, also for a radar chart. Empty is automatic. |
| Y axis starts at 0 | Off | The axis starts at 0 when no Y minimum is set |
All fields are listed in Chart.
How the chart reads its data
- Line, area and bar read the history: averages over intervals of at least 30 seconds, coarser for long ranges. Reading pauses while the browser tab is hidden. An interval without recorded values is a gap, so the line does not fall to 0 while a device does not communicate.
- Doughnut, pie and radar show the current values; Interval (min) is not used. A series without a value is left out, and ? with its name shows which one is missing. A radar chart draws a negative value as it is; a pie chart and the half gauge draw it as 0.
Which one to use
| Chart object | Trend object | Trend screen | Charts | |
|---|---|---|---|---|
| Placed by | The designer, on a page | The designer, on a page | The operator, at any time | The operator, by clicking objects |
| Signals | Fixed in the design | Pens of the design; the operator can change them if allowed | Chosen by the operator, up to 8; saved as profiles | Clicked on the screen; saved as templates |
| Axes, cursors | One axis | One axis per pen or unit, zoom, vertical scale, ruler, statistics | One axis per unit, zoom, cursor and A/B ruler | As the Trend object, or XY charts |
| Min / max, alarm limits | — | Shown if set in the design | Shown on the chart | — |
| Quality marks | — | Shown on the chart | Shown on the chart | Shown on the chart |
| Energy per period | — | — | Hourly, daily or monthly | — |
| Export | — | Excel, CSV, HTML, image | CSV (Export data) | Excel, CSV, HTML, image |
Bars per period, monthly targets and statistics such as a histogram are in Period and analysis charts.