Logs and diagnostics
When something does not work as expected, start with the processes and their resources, then read the log. This page shows where each piece of information is. Starting and stopping processes is described in Manage the stack.
The log files
scada-manager writes the output of all YTCC processes to one file a day in the logs folder of the installation,
for example C:\ytcc\v15\logs\scada-manager.2026-10-23.log. A new file starts at midnight; files older than 10 days are
deleted then. Open the folder in Windows Explorer on the server and the file in a text editor. Support can change the
number of days with log_days in config\log.toml; 0 keeps every file.
Each line names the process it comes from, for example proc=api-gateway. Changes to projects, users and settings are
recorded separately in the audit logs; see Audit logs.
Steps
1. Check the processes and resources
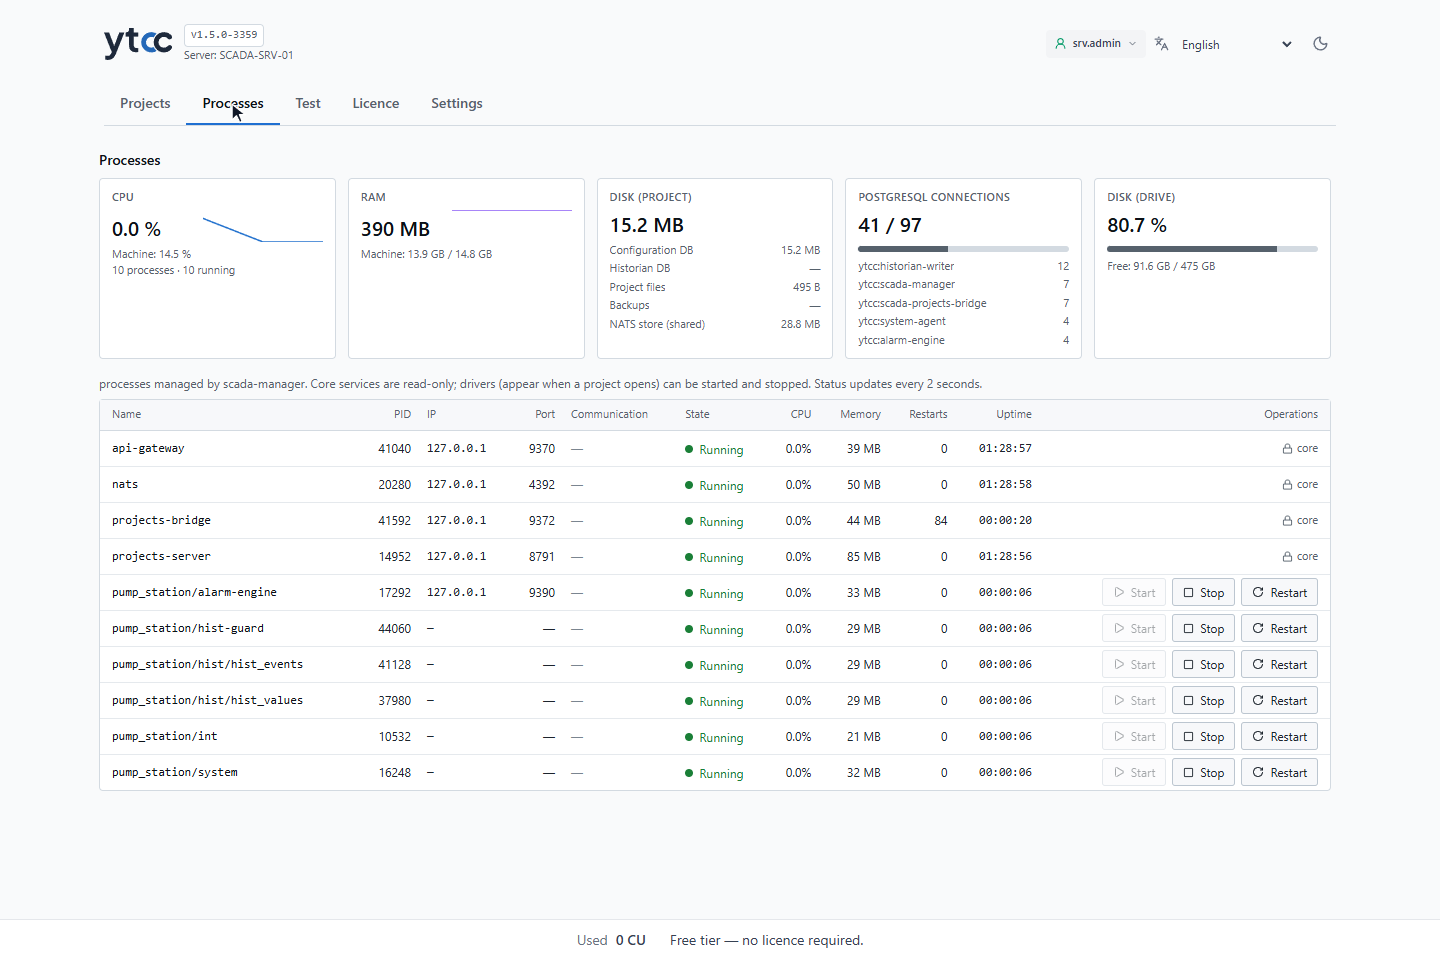
On the home page, click Processes. The resource cards show the processor and memory load of the server and the
disk use of the open project: configuration database, history database, project files, backups and the shared message
store. The PostgreSQL connections card shows the connections in use against the limit of the server (its
max_connections minus the connections reserved for administrators), yellow from 80 % and red from 95 %, and the five
applications that hold the most connections; YTCC processes appear as ytcc:<program> (see
Connections to PostgreSQL). The table below lists every process with its state, address,
processor, memory, restarts and uptime, and refreshes every 2 seconds.
2. Open the diagnostics on the runtime screen
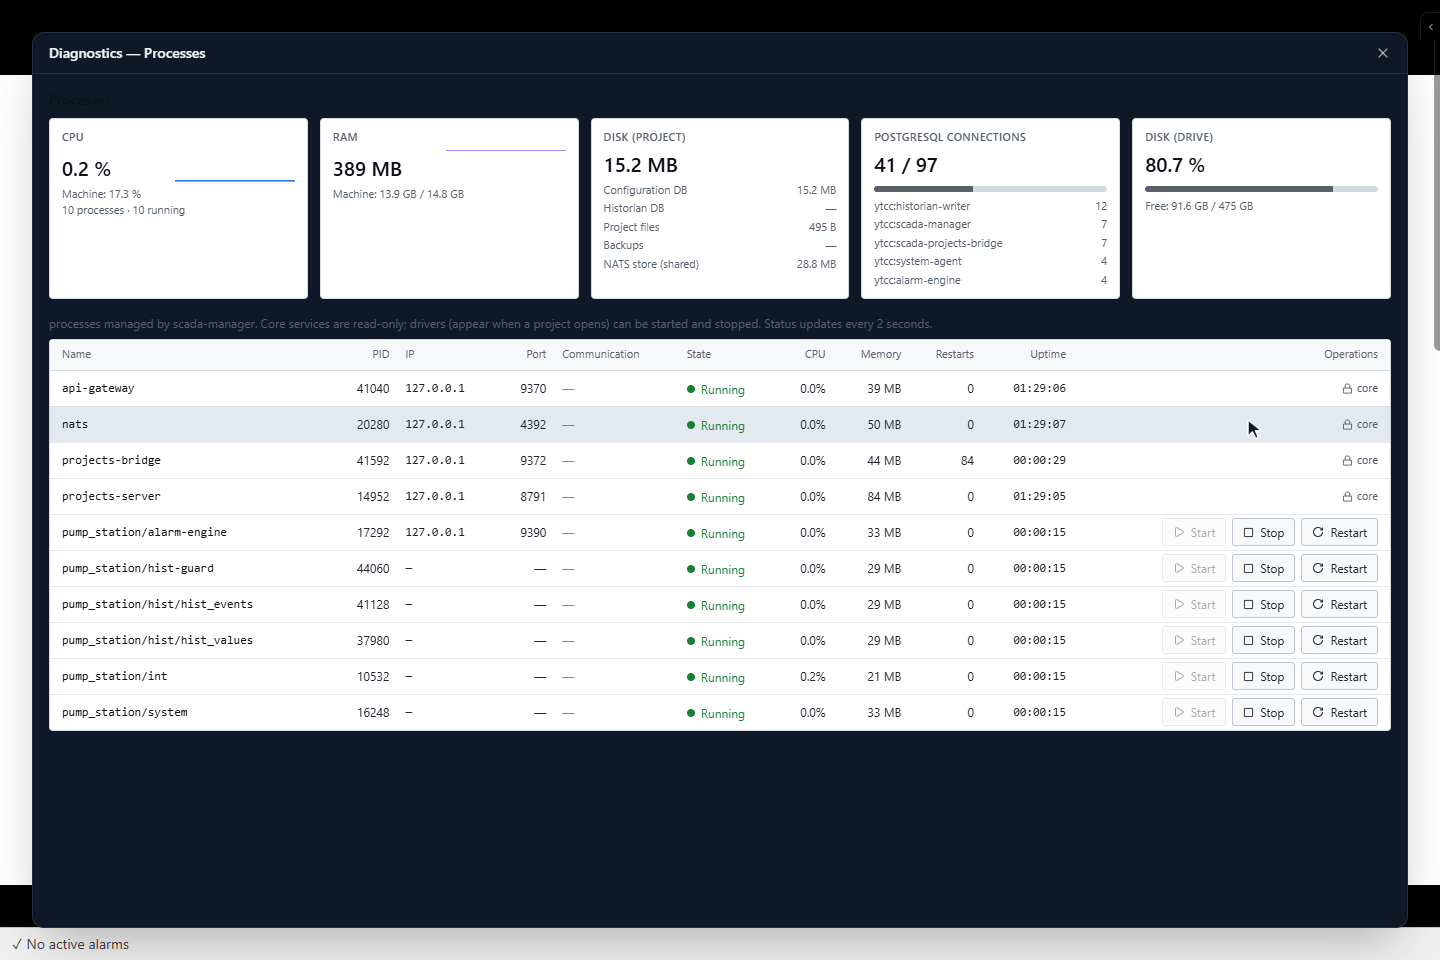
On the runtime screen, click the gear Settings at the top right, then Diagnostics at the bottom of the menu. The panel shows the same resource cards and process table over the screen. Esc or the close button closes it.
3. Measure the screen change times
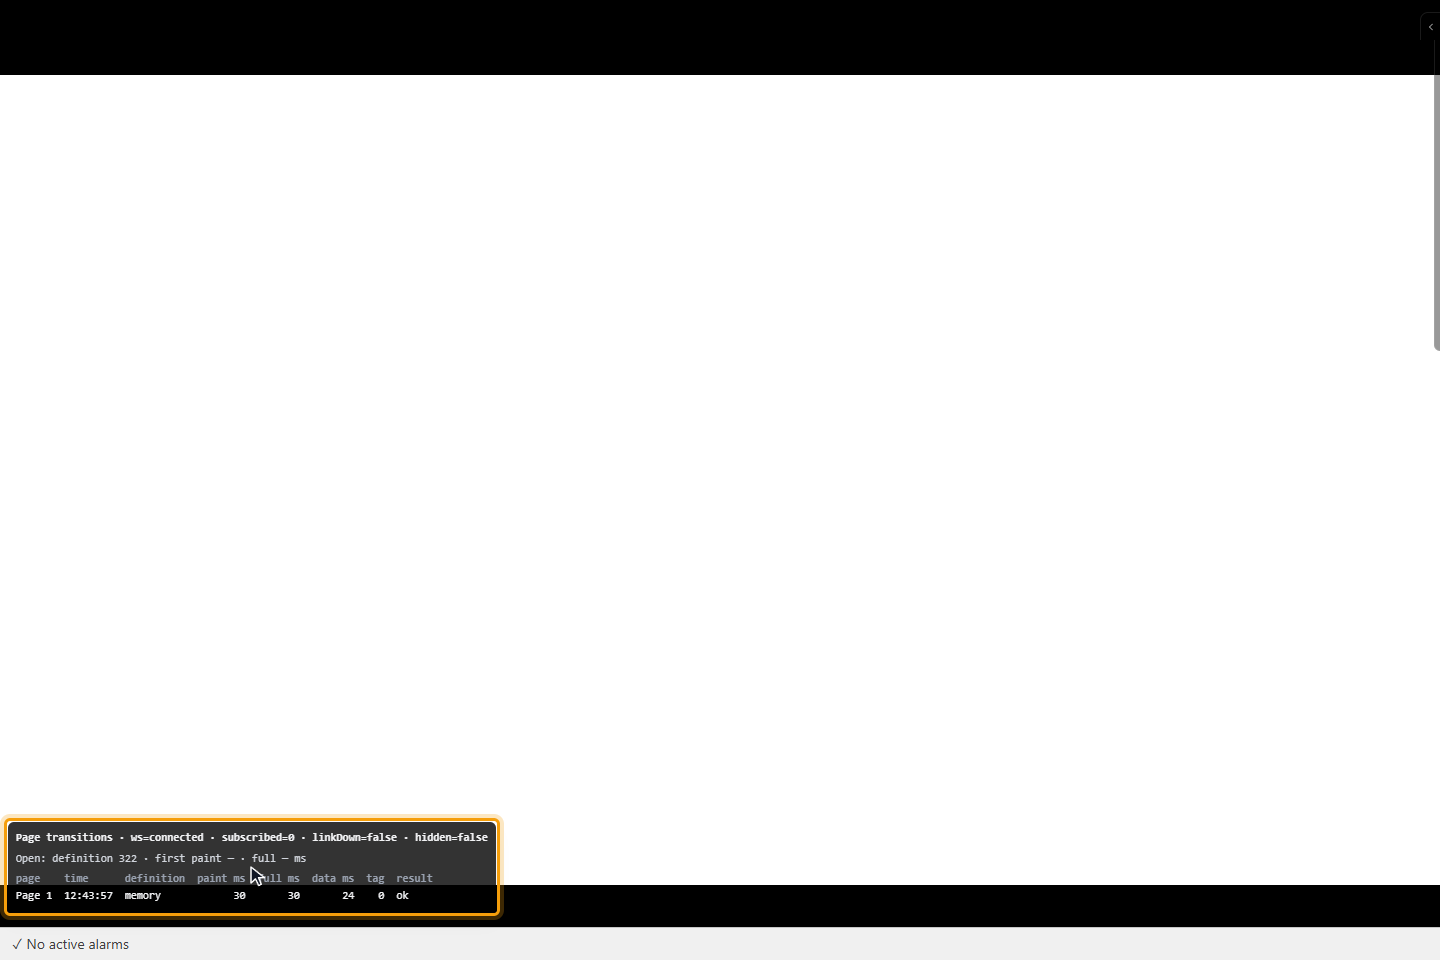
Open the runtime screen with &diag=1 at the end of its address, for example
http://localhost:8773/runtime.html?project=scada_proj_pump_station&diag=1. The Page transitions panel at the
bottom lists each page change with the page, the time, where the page definition came from (memory or
network), the milliseconds to the first drawing, to the complete drawing and to the first data, the number of
signals and the result. A drawing or data time above the limit, and a timeout, are red. The line Open shows the
times of the start of the runtime screen.
The health address
http://localhost:8770/health answers {"status":"ok"} while the gateway runs. A monitoring system can poll it; it
says nothing about drivers or projects.
Good to know
- The process table needs a session. Without one it shows Error: session required; sign in as root on the home
page, or with your project account on the runtime screen.
scada-manager statuson the server prints the same table without a sign-in.