Voltage levels, sources and palette
The colors of a single-line diagram come from two project tables: the voltage levels (color, nominal voltage and measurement thresholds) and the sources (which network feeds a section). They are the same on every page, so a color always means the same thing to the operator. For how the colors are worked out, see How the live single-line diagram works.
Before you begin
- A page with electrical symbols is open in the screen editor. See Place symbols and draw wires.
Steps
1. Open the electrical settings
Click an empty place on the canvas. In PROPERTIES, scroll to ELECTRICAL › COLORING.
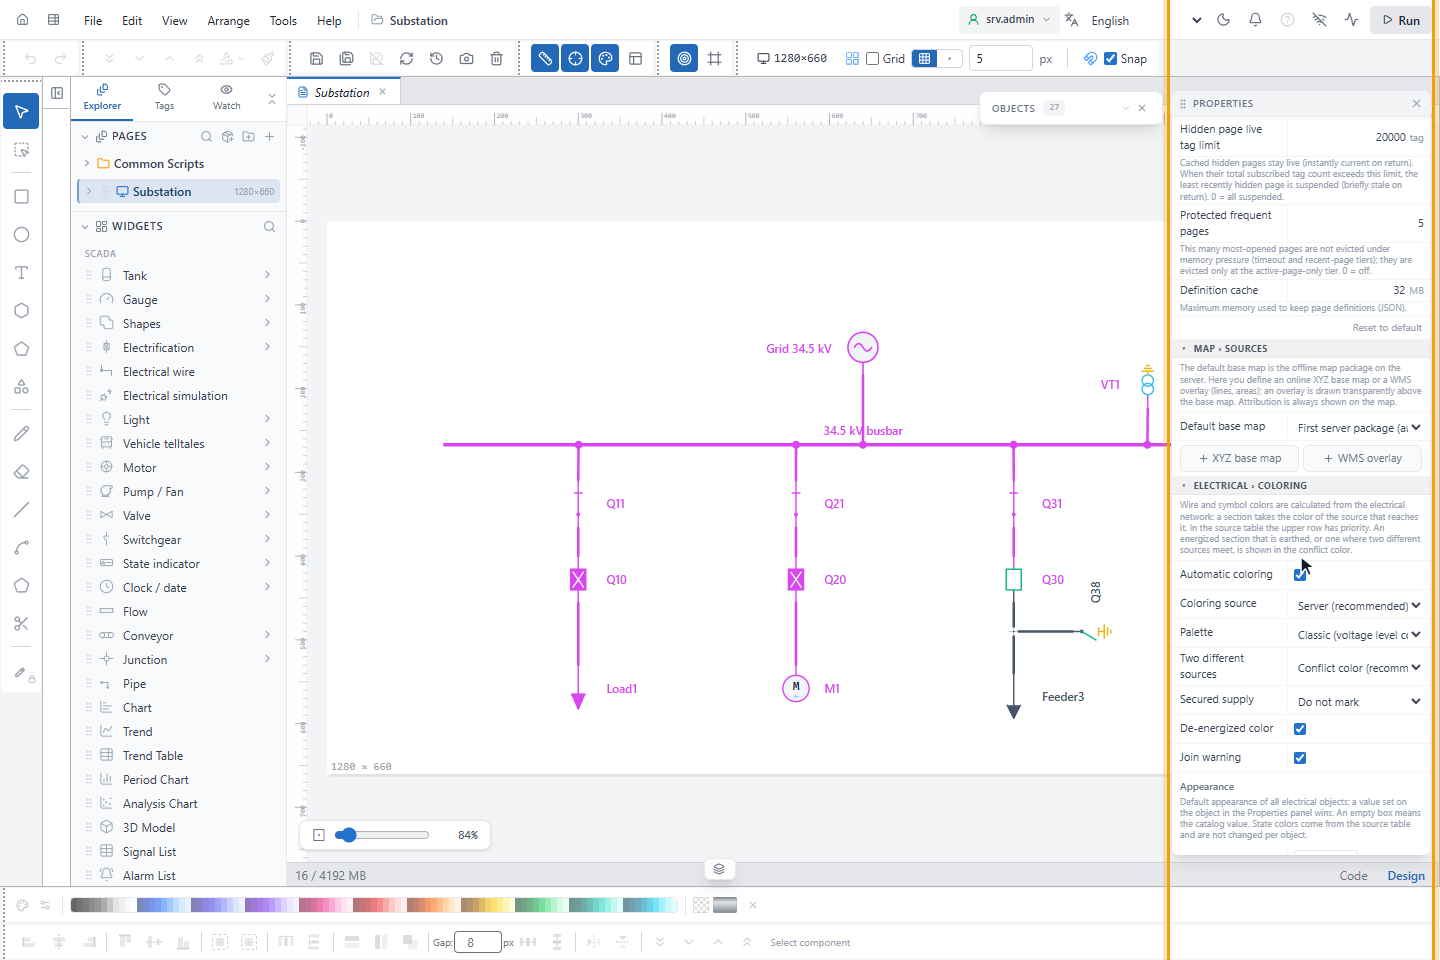
| Setting | Default | Meaning |
|---|---|---|
| Automatic coloring | on | Off: symbols keep their design color. Interlocks, warnings and the ? mark still work. |
| Coloring source | Server (recommended) | Where the states are calculated; see Where the colors are calculated. |
| Palette | Classic (voltage level colors) | ISA-101 (normal state gray) draws normal states grey and colors only abnormal ones. |
| Two different sources | Conflict color (recommended) | For sources that may run together (a Parallel level): Color of the priority source or Two colors, dashed. |
| Secured supply | Do not mark | A section that stays fed after losing one switch or transformer (ring, parallel transformers): Double width or Brighter tone. |
| De-energized color | on | Off: de-energized sections keep their design color. |
| Join warning | on | Show a badge on a switch whose closing would join two networks. |
Appearance below sets the default line widths and labels of all electrical objects; a value set on an object wins. State colors cannot be changed per object: a color must mean the same on every screen.
2. Set the voltage levels
Under Voltage levels, each row has a color, a name, AC or DC, the nominal voltage Un, Dashed, Parallel and three thresholds for measurements.
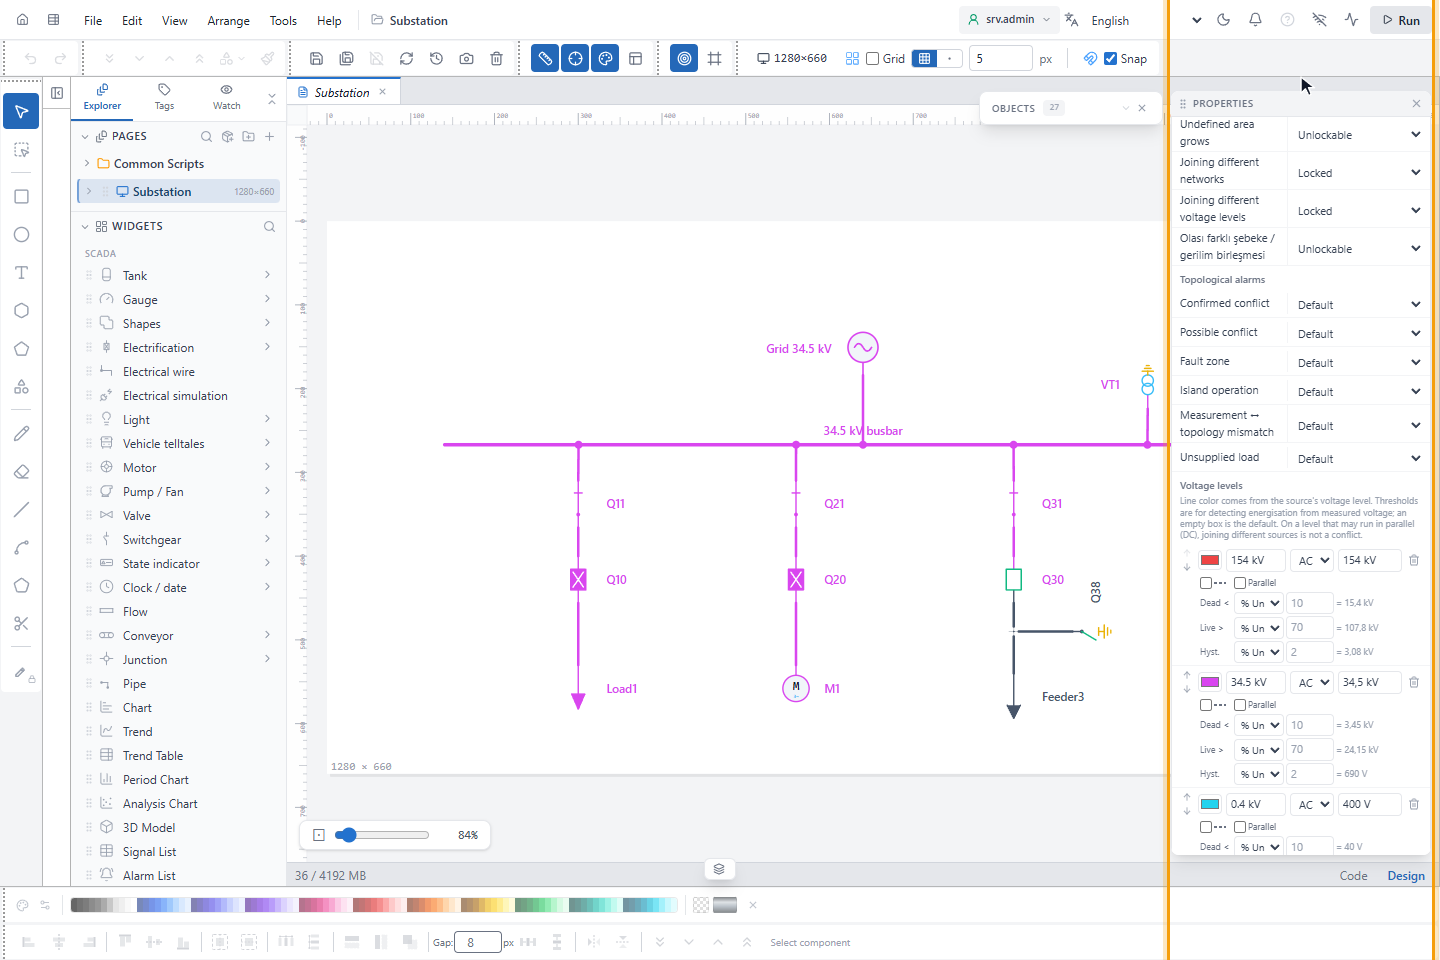
A new project has six levels: 154 kV, 34.5 kV and 0.4 kV (AC), a 1000 V DC level for BESS and PV and a 750 V DC traction level (both DC, parallel), and a 27.5 kV AC railway level.
- Parallel: sources of this level may meet without a conflict, for example DC rectifiers on a catenary. On by default for DC and off for AC, because paralleling two AC networks needs synchronisation. When both levels have an Un, a different nominal voltage, or AC meeting DC, is a conflict.
- Un empty: no voltage mix check and no % Un thresholds for this level.
- Add level adds a row; deleting a level moves its sources to the first level. The last level cannot be deleted. After a change, a round arrow button (Reset to default levels) returns to the default table.
The thresholds decide what a voltage measurement means. Each is one number in % Un or V:
| Threshold | Default | Meaning |
|---|---|---|
| Dead < | AC 10 % Un, DC 20 V | Below: no voltage. |
| Live > | 70 % Un | Above: voltage present. Between the two is residual voltage, which does not count as energized. |
| Hyst. | 2 % Un | Stops flickering around a threshold. |
Below the table:
| Setting | Default | Meaning |
|---|---|---|
| Section color | From level (recommended) | From source draws each source in its own color instead of its level's color. |
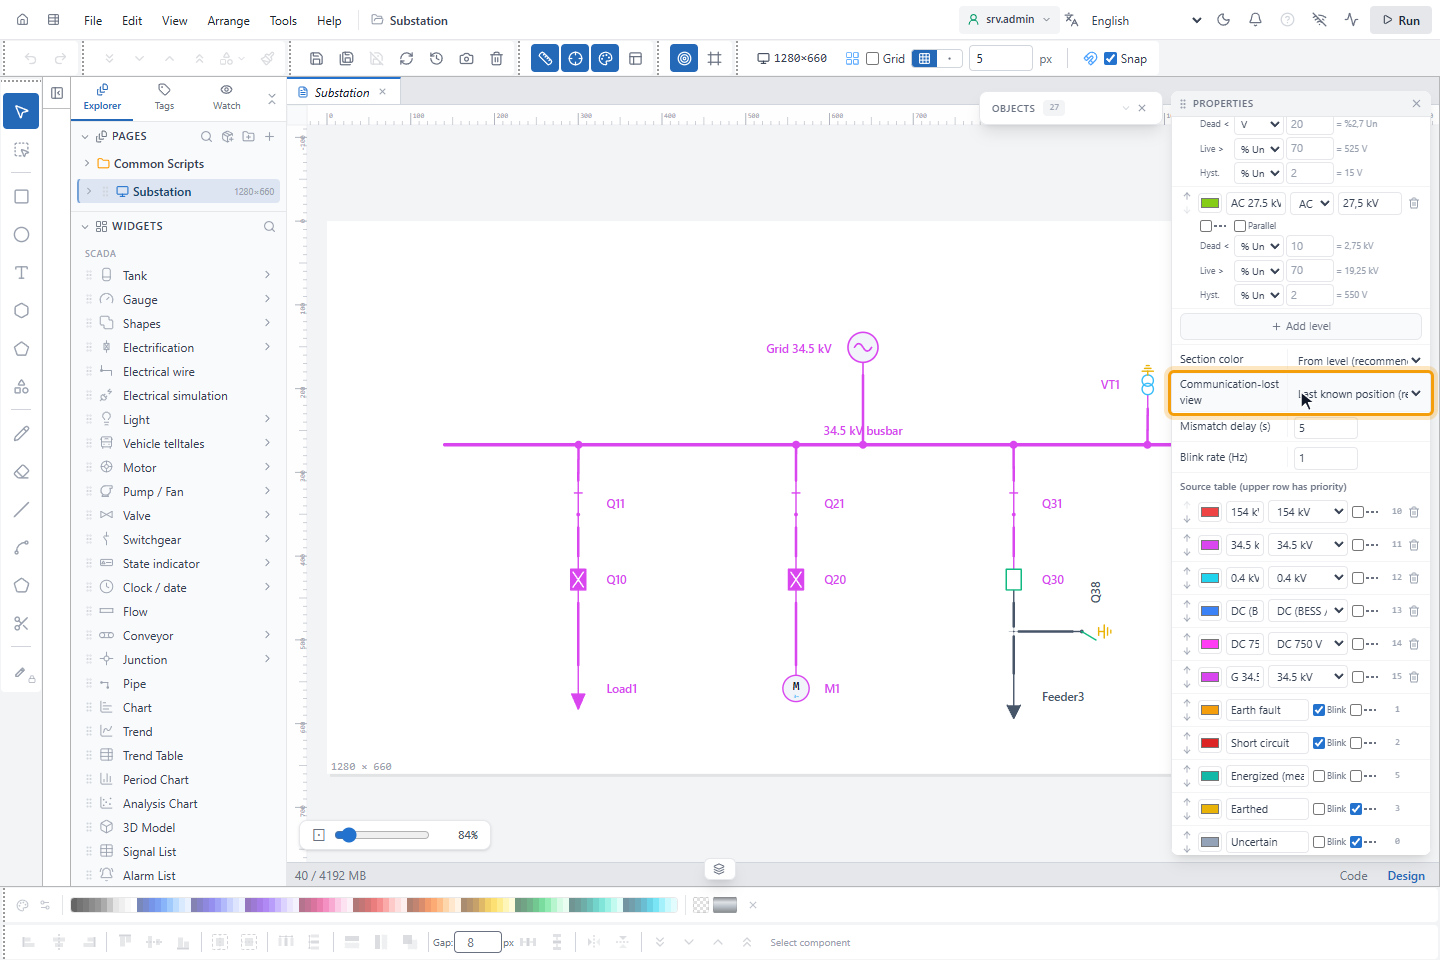
| Communication-lost view | Last known position (recommended) | Default view of a switch without communication; see step 5. |
| Mismatch delay (s) | 5 | How long topology and measurement may disagree before the mismatch is shown, 0–60. |
| Blink rate (Hz) | 1 | 0.1–3. 3 Hz is the photosensitivity limit. |
3. Set the sources
Source table (upper row has priority) lists the networks. Each row has a color, a name, its voltage level and Dashed; the upper row wins when two sources reach one section. Two networks of the same level, for example the grid and a generator at 34.5 kV, need two sources: when they meet, YTCC shows a conflict. Add source adds a row.
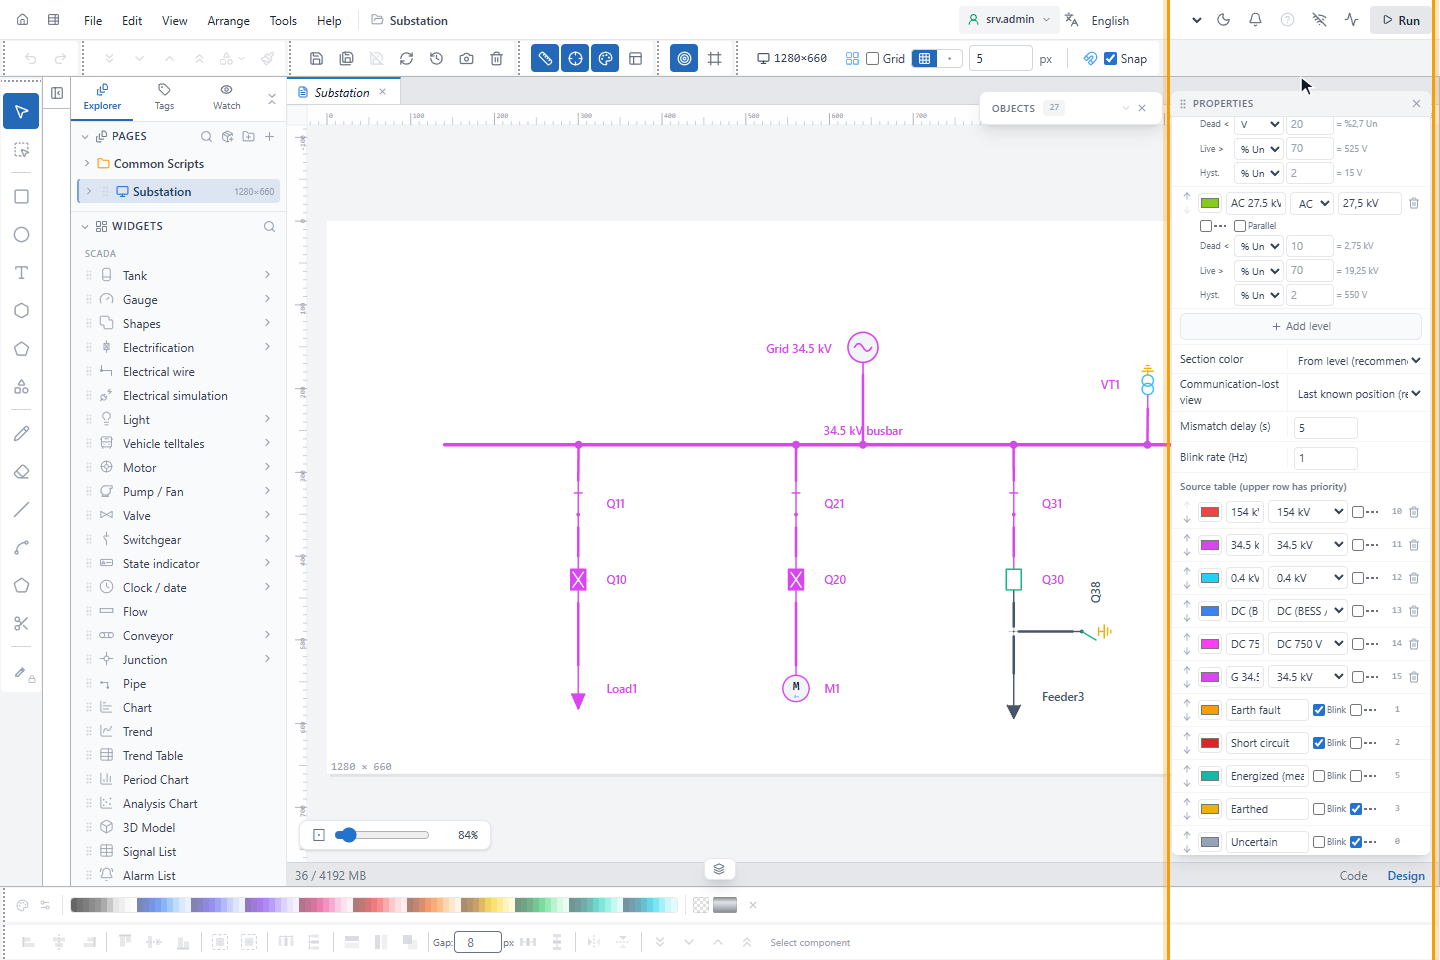
The system states at the end of the table cannot be deleted; set their color and Blink there:
| State | Default |
|---|---|
| Earth fault | Amber, blinking |
| Short circuit | Red, blinking |
| Energized (measured) | Teal |
| Earthed | Yellow, dashed |
| Uncertain | Grey, dashed |
| De-energized | Grey |
| No communication | Pink, steady |
4. Choose the source of each source symbol
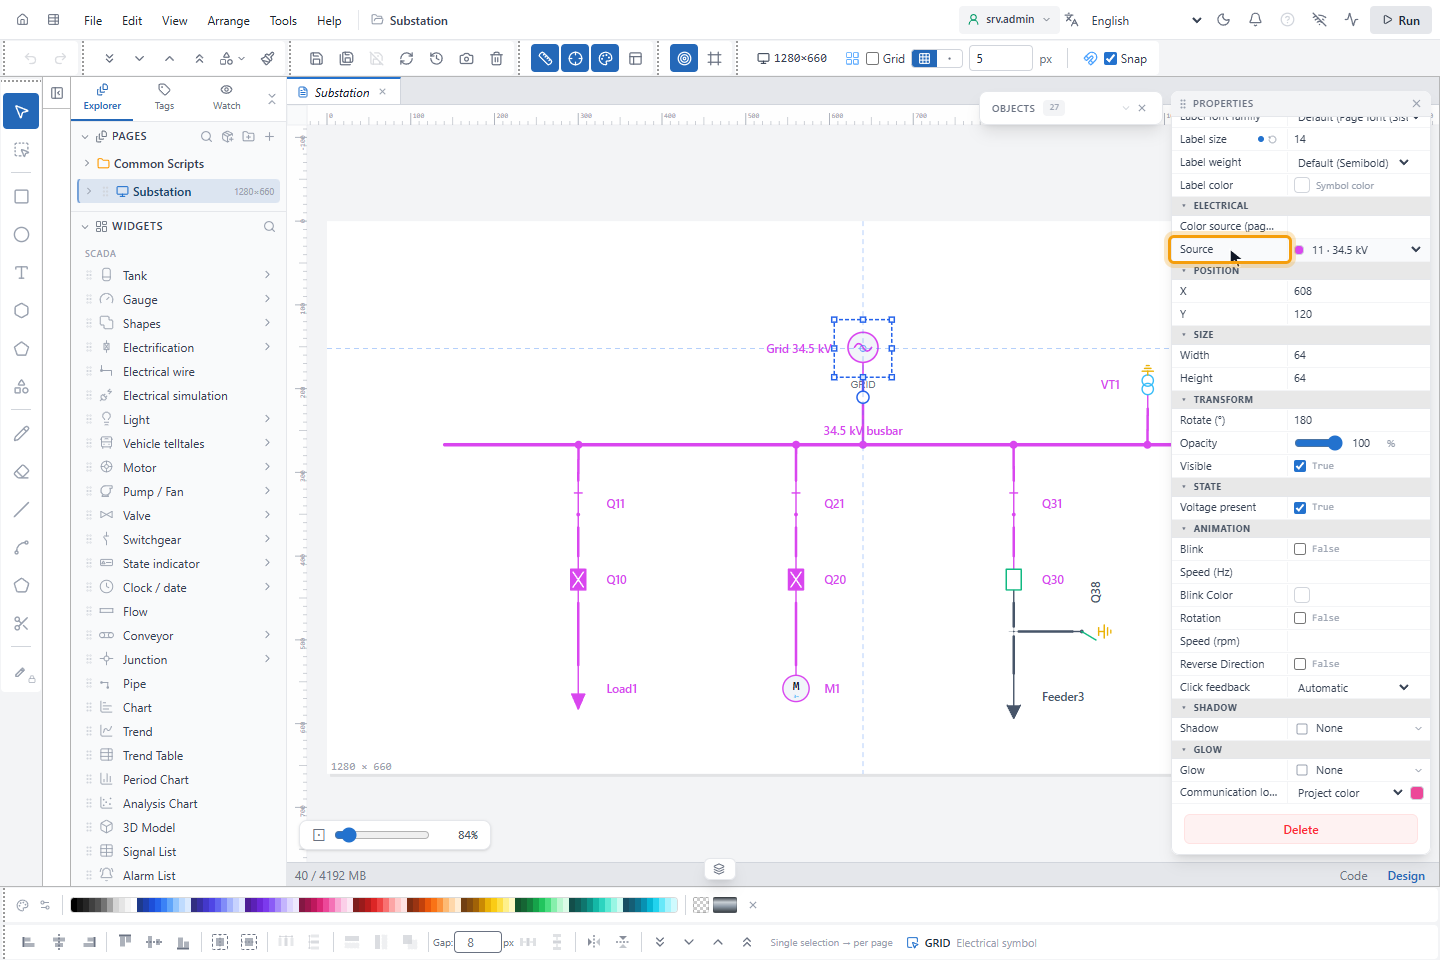
Select a source symbol (grid supply, generator, PV…) and choose its Source in PROPERTIES. For a transformer or a converter, Source is the source of the lower side, Reverse feed source the source of the upper side when it is fed from below (empty: no energy upwards), and Third winding source the third winding of a three-winding transformer.
5. Choose the communication lost view
Communication-lost view sets how a switch without communication is drawn by default: Last known position (recommended) or Unknown (grey ?).
On the run screen, while a symbol of the page has lost communication, a button on the control rail shows the current view in its tooltip, Showing last known values or Position hidden while communication is lost; clicking it switches. The choice is kept for each user and page.
Result
The diagram shows the new colors at once in the editor. Run the project to see them with live values.