Put alarm objects on a screen
Five objects in the SCADA group of the palette show alarms on a screen:
| Object | Shows |
|---|---|
| Alarm List | The active and shelved alarms and the alarm history, with acknowledge, shelve, filters and download |
| Alarm group | A card per alarm group with its counters; a click opens the group's alarms |
| Alarm strip | The latest alarm events in a fixed number of lines, like a printer log |
| Alarm band | Counters, unacknowledged alarms, the trip cause per unit, acknowledge buttons and the horn in one bar |
| Trip causes | The opening of one breaker and the cause signals that came before it |
In addition, the runtime screen has an alarm bar along its bottom edge. This page places the first three objects on a new
page Alarms and the other two on a new page Control room, and tries them in a test run. How an operator reads and
acknowledges alarms is in the Operator guide.
Before you begin
- The project has alarms; here two deviation alarms of the example project are active.
- For the Alarm group object, alarm groups have been set up; here the group
stationcollects every alarm from Low priority up. See Alarm classes and groups. - For Alarm band and Trip causes, the breaker signals and the cause signals are recorded in an event table. See Archive tables.
Steps
1. Place an alarm list
In the screen editor, open the page, click Alarm List in the palette and drag a rectangle on the page. In the Properties panel, the Scope group decides which alarms the list shows.
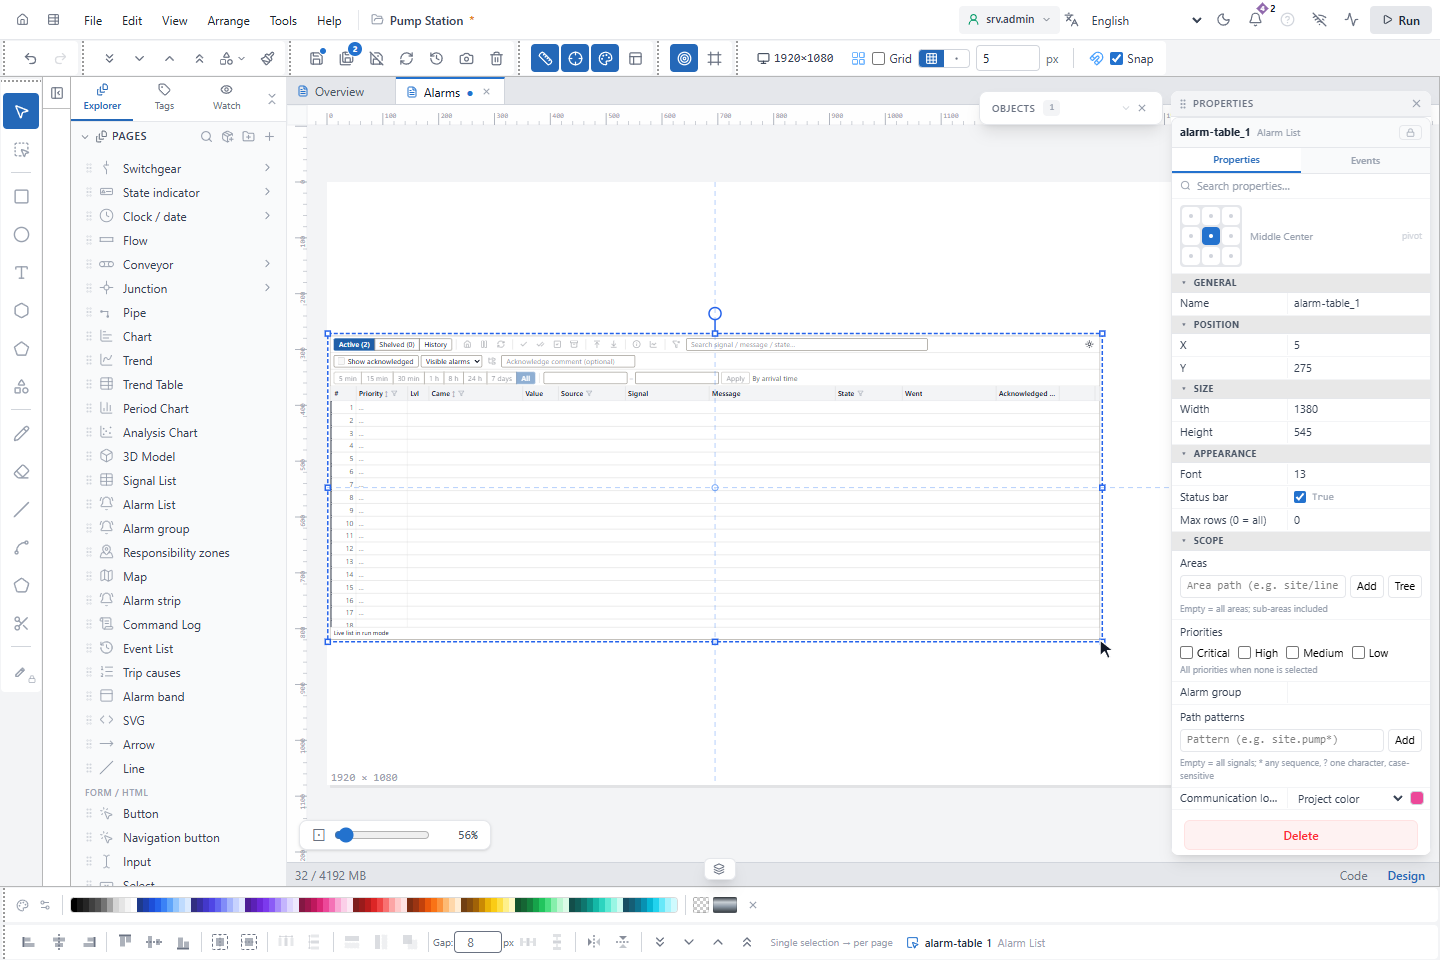
| Scope | Shows |
|---|---|
| Areas | The alarms of the areas and their sub-areas; add an area with Add or pick it in Tree. Empty: all areas |
| Priorities | The alarms of the chosen priorities. None chosen: all priorities |
| Alarm group | The alarms of a group and its sub-groups |
| Path patterns | The alarms of signals whose path matches; * is any sequence, ? one character, letters are case-sensitive. Empty: all signals |
Several entries in one box widen the list; different boxes narrow it. The operator's own filters on the runtime screen apply within the scope, also to the history and the downloaded files. Up to 64 areas and 32 path patterns can be entered.
2. Place an alarm group
Click Alarm group in the palette and drag a rectangle. In Scope, add the group names with Add; empty shows all groups. Here Acknowledge group button under Counters is turned on.
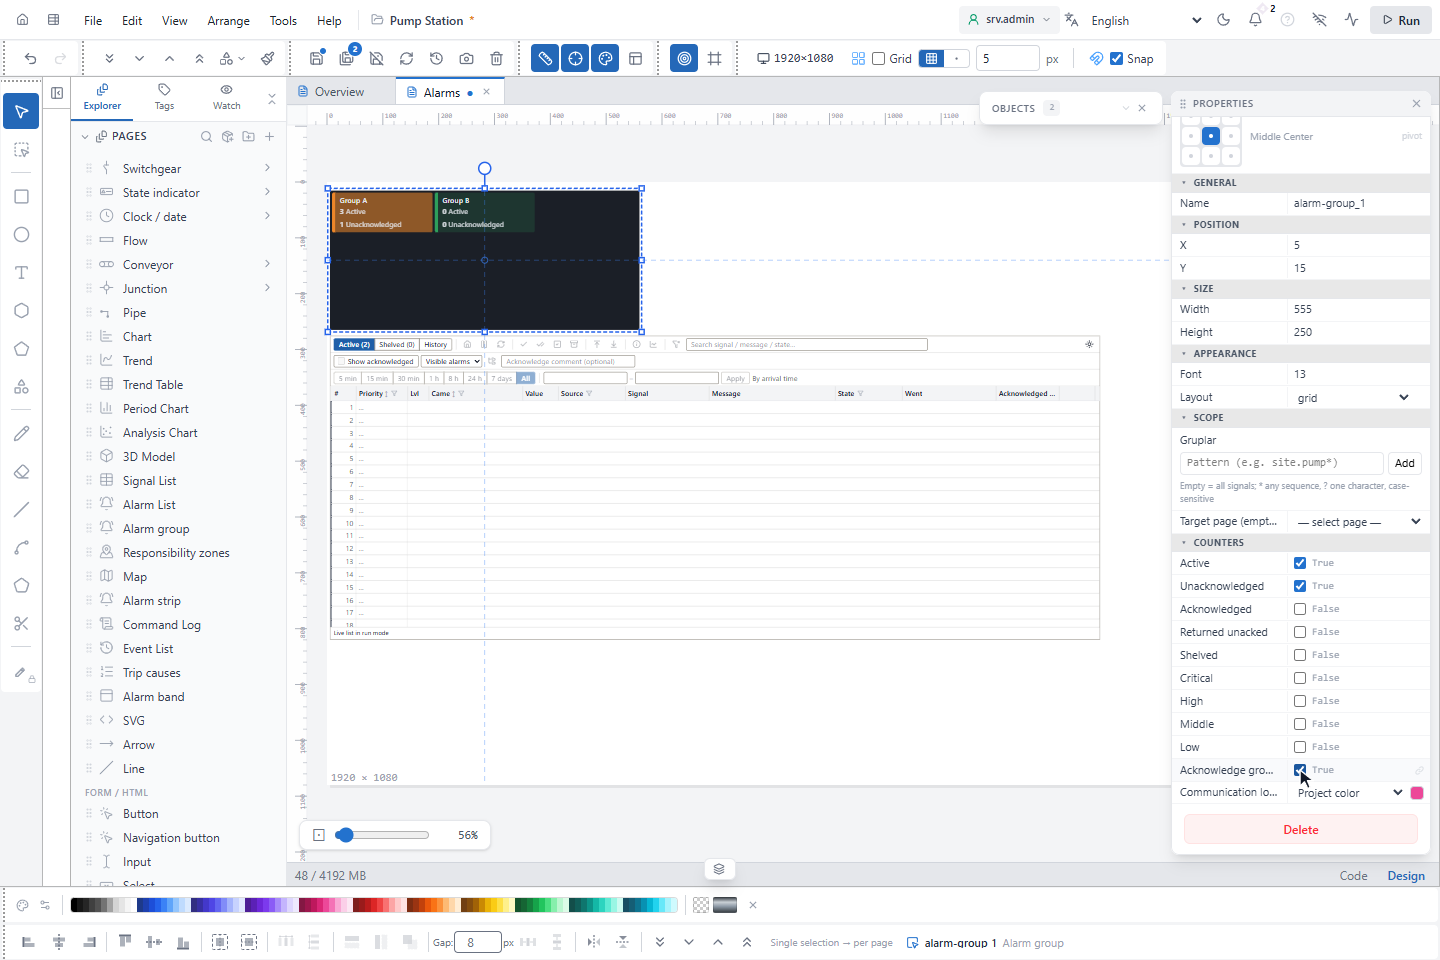
| Property | Effect |
|---|---|
| Layout | grid cards side by side (default) or a list |
| Target page (empty = alarm page) | The page a click on a card opens; empty opens the first page with an Alarm List |
| Counters | Active, Unacknowledged, Acknowledged, Returned unacked, Shelved and the four priorities; with none chosen the card shows Active and Unacknowledged |
| Acknowledge group button | Adds an Acknowledge group button to each card |
The box of the target page lists the other pages of the project; the page you are editing cannot be chosen. This applies to every page box of this page.
3. Place an alarm strip
Click Alarm strip in the palette and drag a wide, low rectangle.
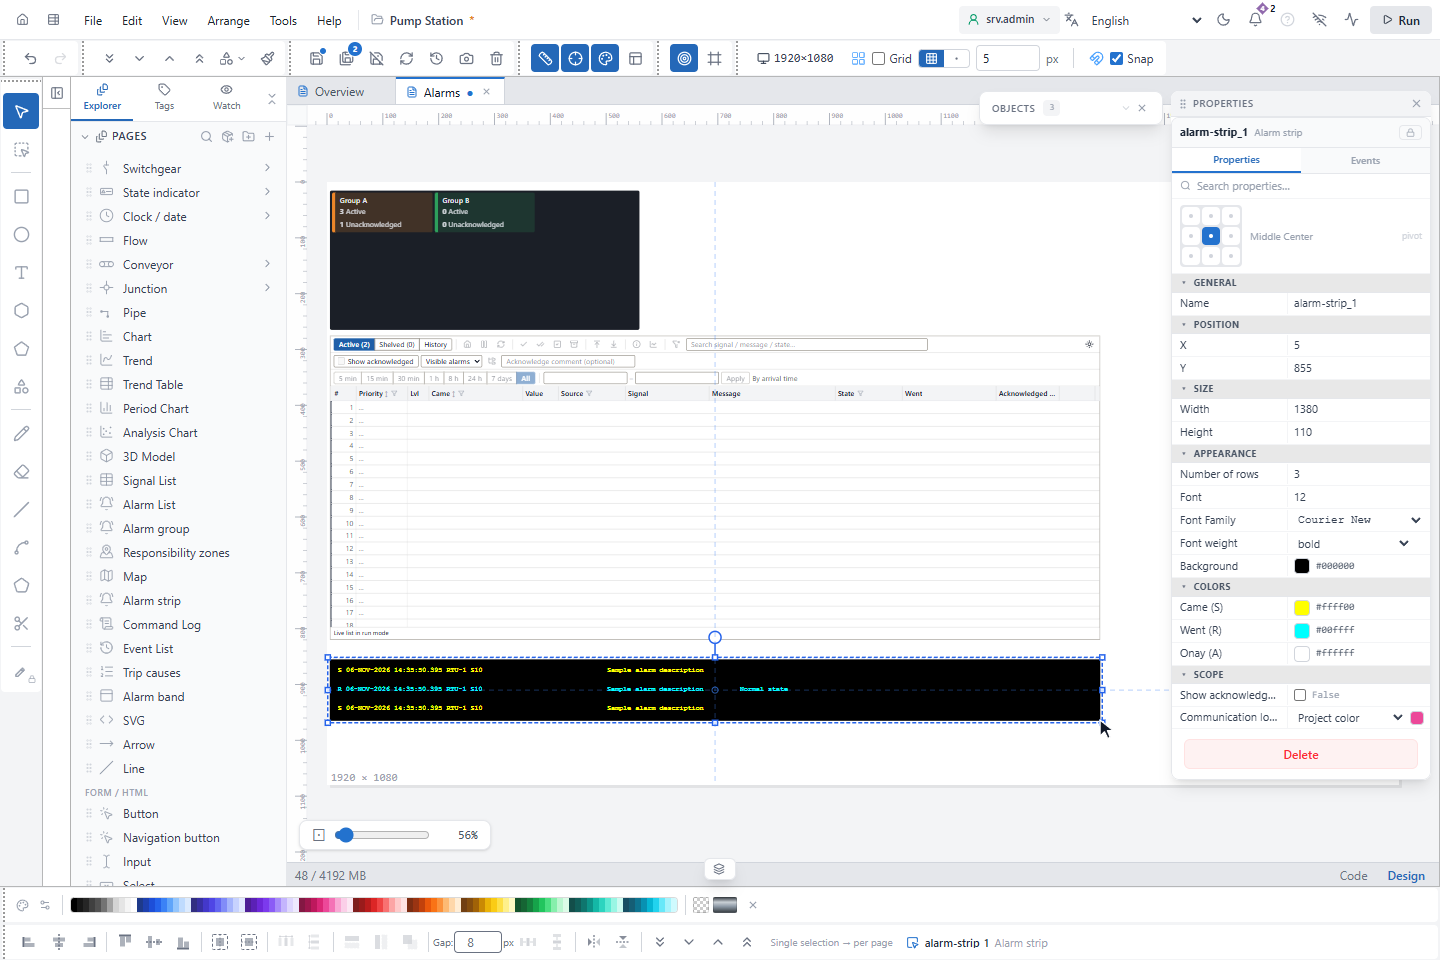
Each line starts with S for an alarm that came, R for one that went and, with Show acknowledgements, A for an acknowledgement, followed by the time, the signal and the message. Number of rows sets how many lines are shown, newest at the top, and Colors set the color of each letter. The strip always shows the whole project and cannot be clicked.
4. Try the alarm objects
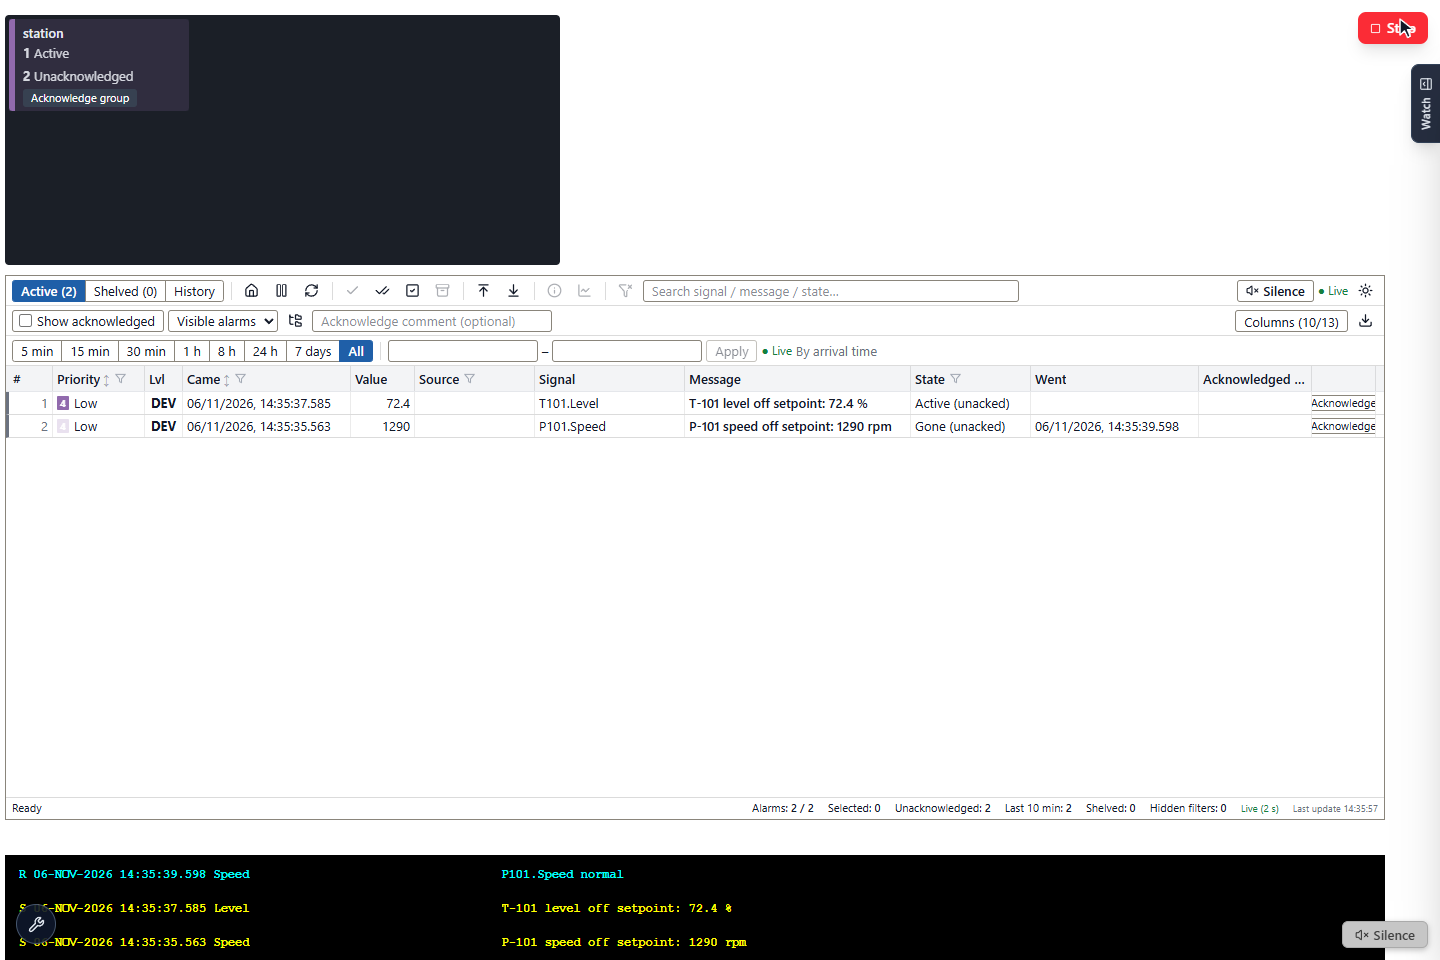
Save the page and click Run. The list shows the alarms with their level, time, value, message, priority and state.
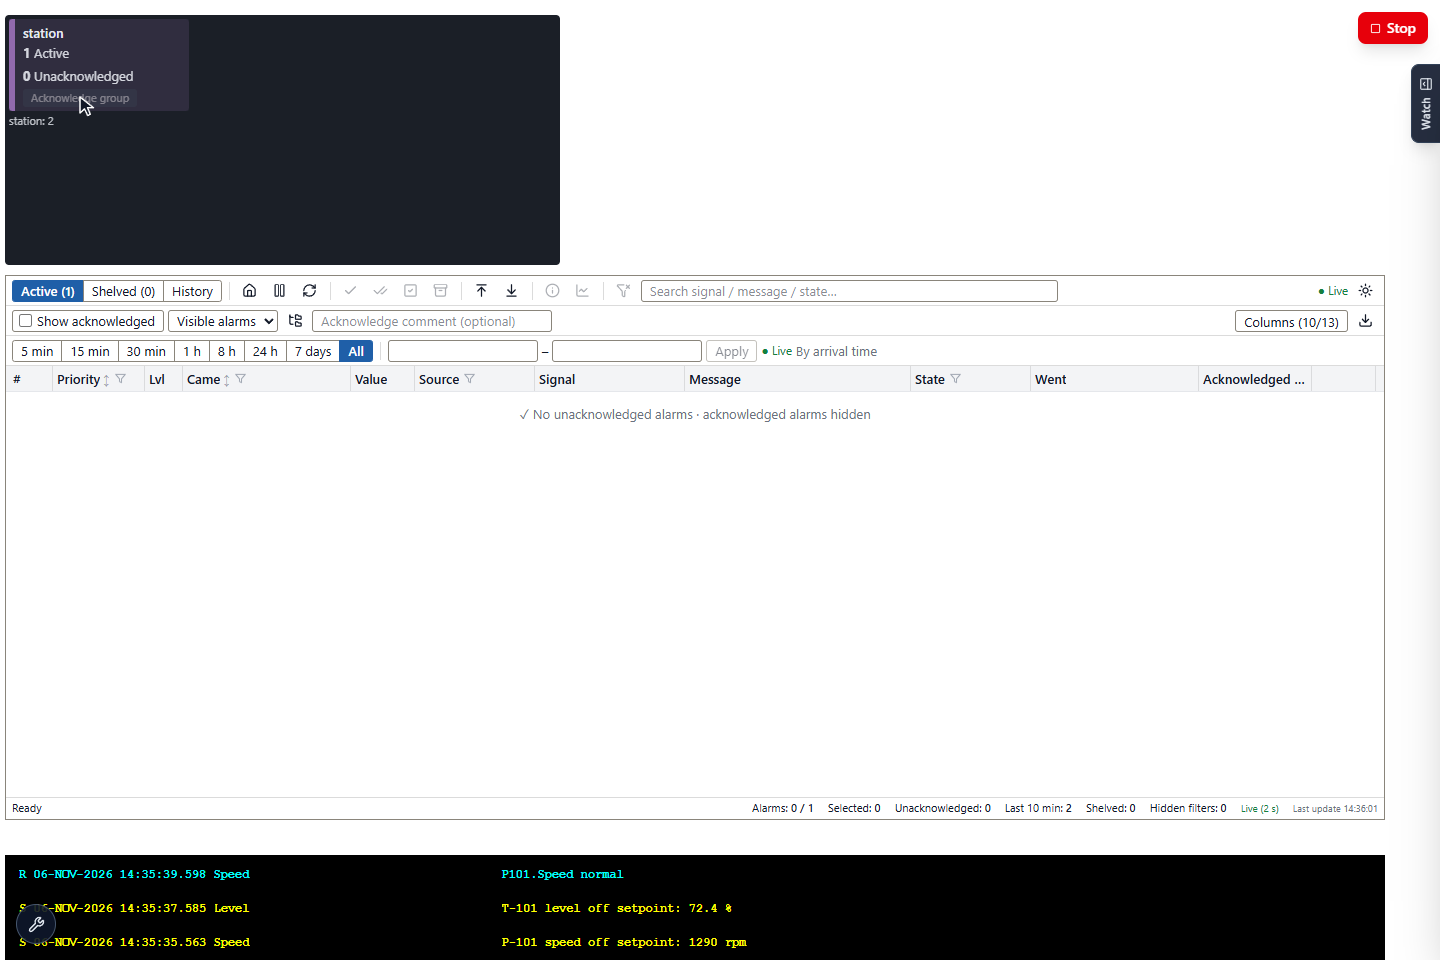
The card of station counts one active alarm and two awaiting acknowledgement, and the strip shows the events.
5. Acknowledge a group
Click Acknowledge group on the card. Every alarm of the group that awaits acknowledgement is acknowledged; the card
shows the group and the number of acknowledged alarms, here station: 2. The button is disabled while nothing awaits
acknowledgement, or when the user may not acknowledge alarms. The list now says No unacknowledged alarms ·
acknowledged alarms hidden, because Show acknowledged is off by default.
6. Open the alarms of a group
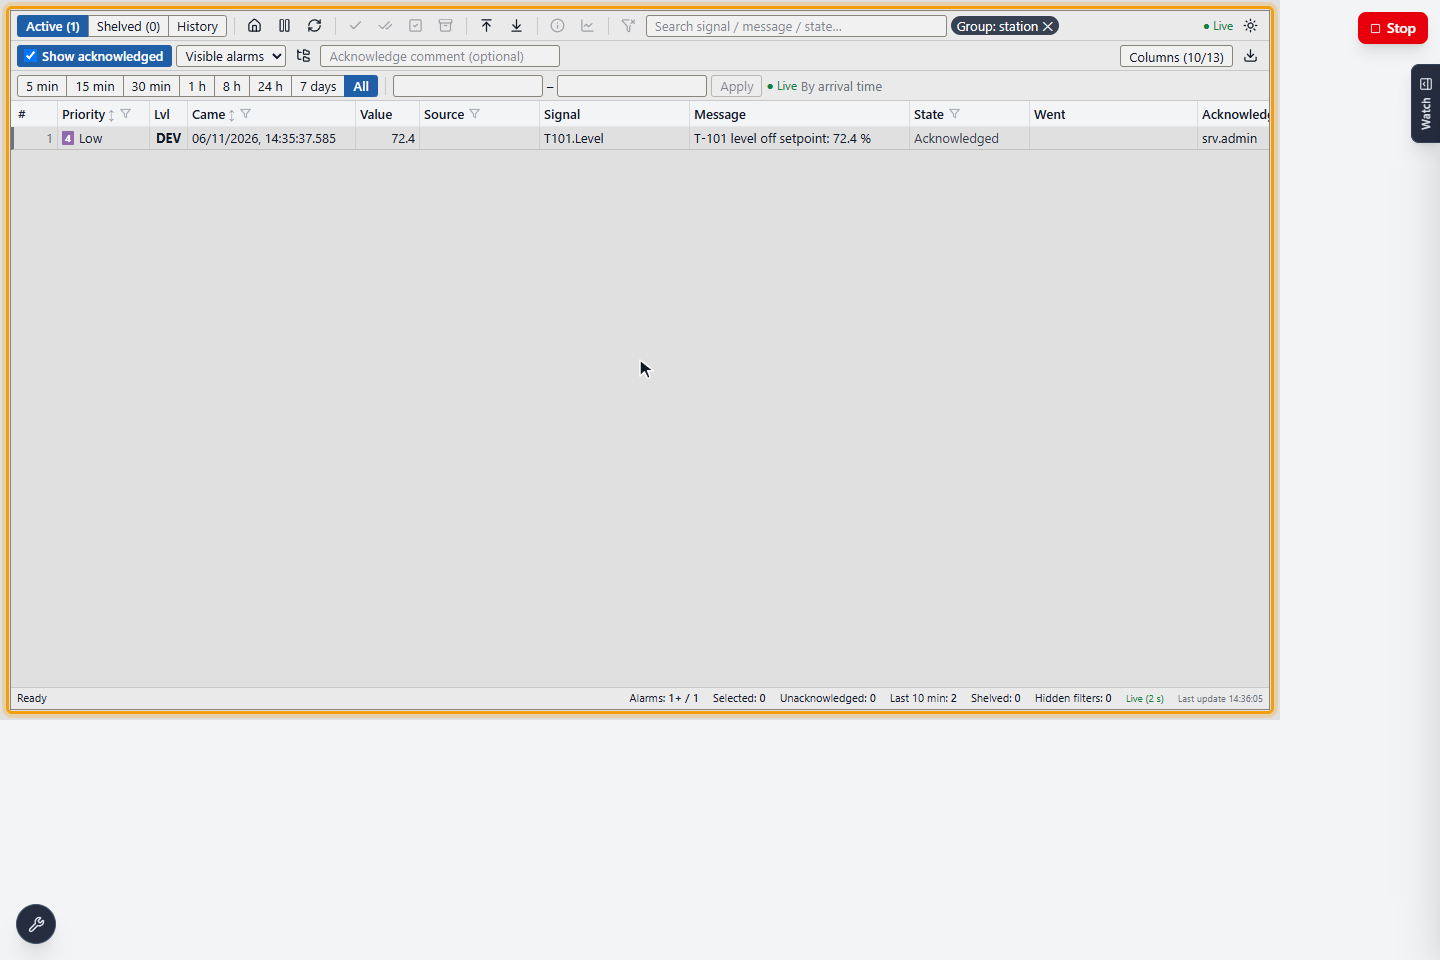
Click the card itself. The target page opens, here Alarm list, the first page with an Alarm List, and the list shows only the group's alarms. The chip Group: station above the list shows the filter; ✕ removes it. Turn on Show acknowledged to see the acknowledged alarms of the group too.
7. Place an alarm band
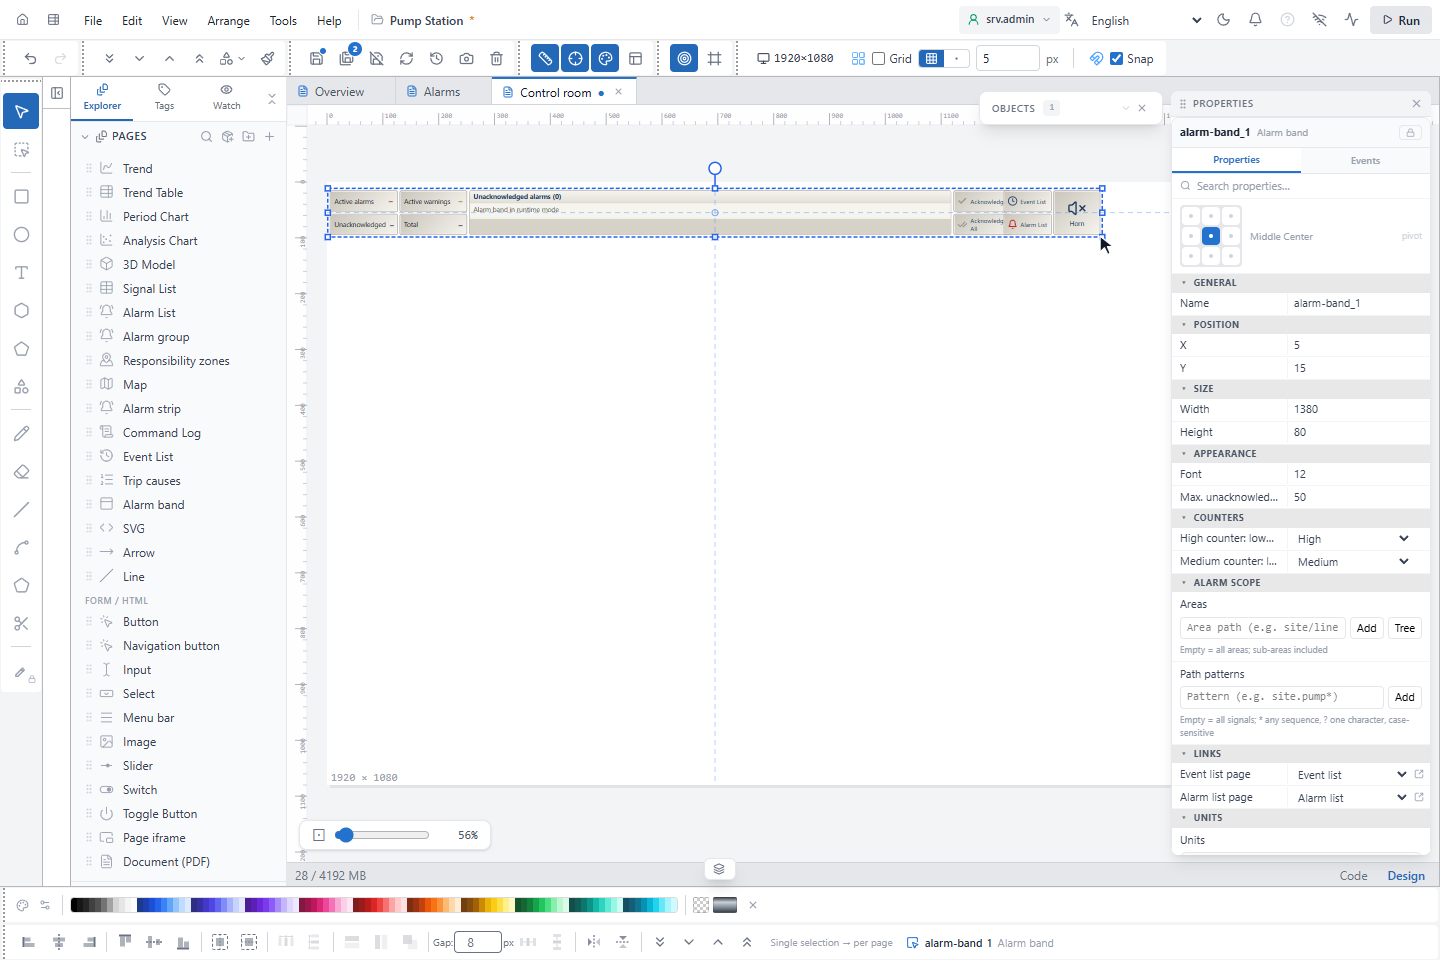
The alarm band is a bar for the top of an operator screen. Open the page, here Control room, click Alarm band in the
palette and drag a wide, low rectangle. The default size is 1520 × 82 pixels.
| Group | Property | Effect |
|---|---|---|
| Appearance | Max. unacknowledged alarms | How many unacknowledged alarms are read, default 50, at most 200. The band shows two rows; the others scroll. |
| Counters | High counter: lowest priority | This priority and above count as Active alarms. Default High. |
| Counters | Medium counter: lowest priority | This priority up to the high threshold counts as Active warnings. Default Medium. |
| Alarm scope | Areas, Path patterns | The alarms of the band, as in the alarm list. Empty: all |
| Links | Event list page, Alarm list page | The pages that the band opens. While a box is empty, its buttons stay disabled, and for Alarm list page the counters too. |
Here the two links point to the pages Alarm list and Event list. See also Alarm band properties.
8. Define the units
A unit is a machine or feeder with a breaker. Scroll to Units and click Add unit. You can add as many units as your plant has; Delete unit removes one.
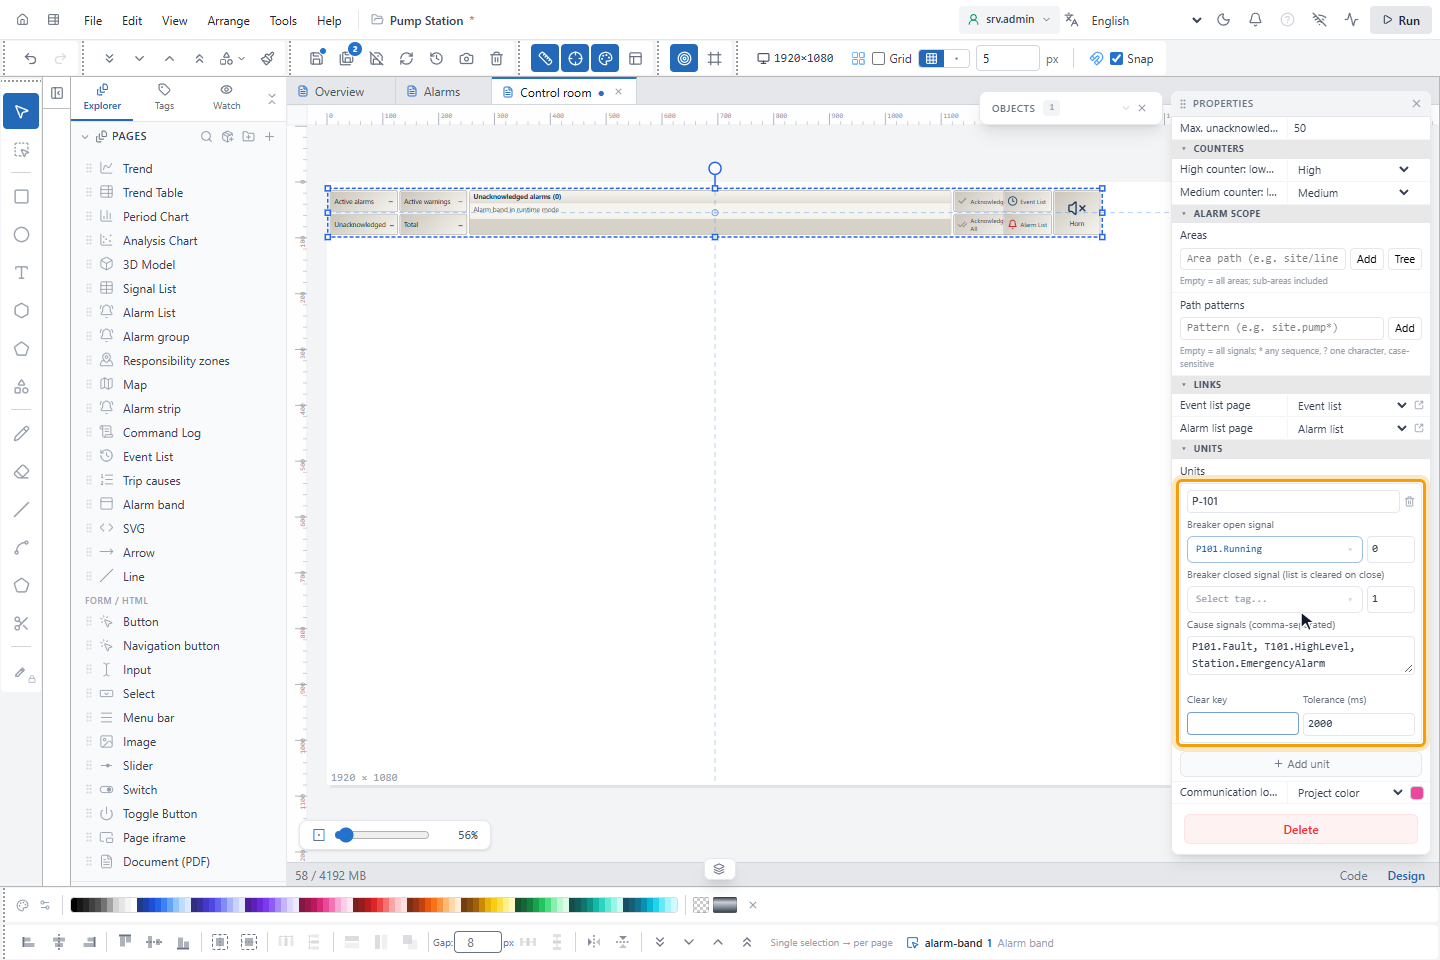
The name and value boxes of a unit card have no label; point at a box to see its name.
| Field | Value |
|---|---|
| Unit name | The name in the title of the trip pane. Default Unit-n |
| Breaker open signal, On value | The signal and value that mean the breaker is open. Default value 1 |
| Breaker closed signal (list is cleared on close), Closed value | The signal and value that mean the breaker is closed. Without this signal, the breaker counts as closed when the open signal leaves its value. |
| Cause signals (comma-separated) | The signals that can cause a trip. Separate them with a comma, space, semicolon or new line. |
| Clear key | Lists with the same key are cleared together. Empty: the list has its own key. |
| Tolerance (ms) | How long after the opening a cause still counts. Default 2000 |
Here the unit P-101 uses P101.Running with On value 0, because the example project has no breaker signal, and the
causes P101.Fault, T101.HighLevel, Station.EmergencyAlarm.
9. Place a trip causes list
Use Trip causes for one breaker on a machine screen. Click Trip causes in the palette and drag a rectangle. The default size is 390 × 80 pixels.
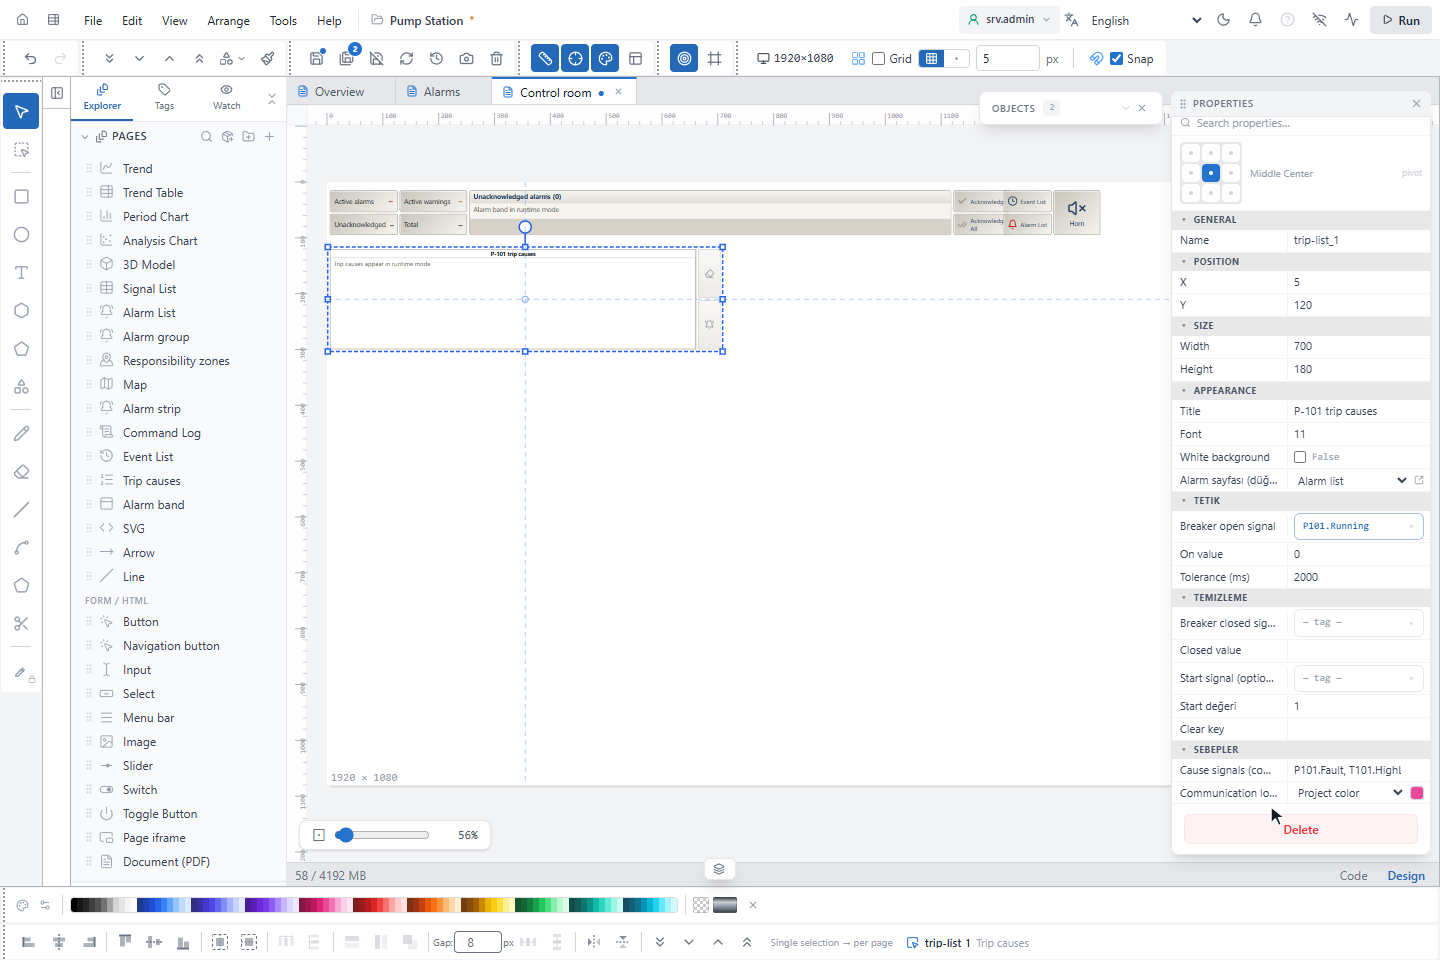
| Property | Effect |
|---|---|
| Title, Font, White background | The look of the list. Type your own title; the default is Durdurma sebepleri. |
| Breaker open signal, On value, Tolerance (ms) | As in the band. Here On value is 0 by default. |
| Breaker closed signal (clears), Closed value | As in the band |
| Start signal (optional), Start değeri | The signal and value of a machine start. When a signal change or a SCADA command reaches this value, the list is cleared. Default value 1 |
| Clear key | As in the band |
| Cause signals (comma-separated) | As in the band |
| Alarm sayfası (düğme) | The page of the Open alarm page button. The button appears only if you choose a page. |
See also Trip causes properties.
10. Try the band
Save the page and click Run. On the right, the band shows Active alarms, Active warnings, Unacknowledged and Total, then the buttons. On the left, Unacknowledged alarms (n) lists the alarms, newest first, colored by priority, with CAME or WENT. Here the communication alarm of Main PLC has come.
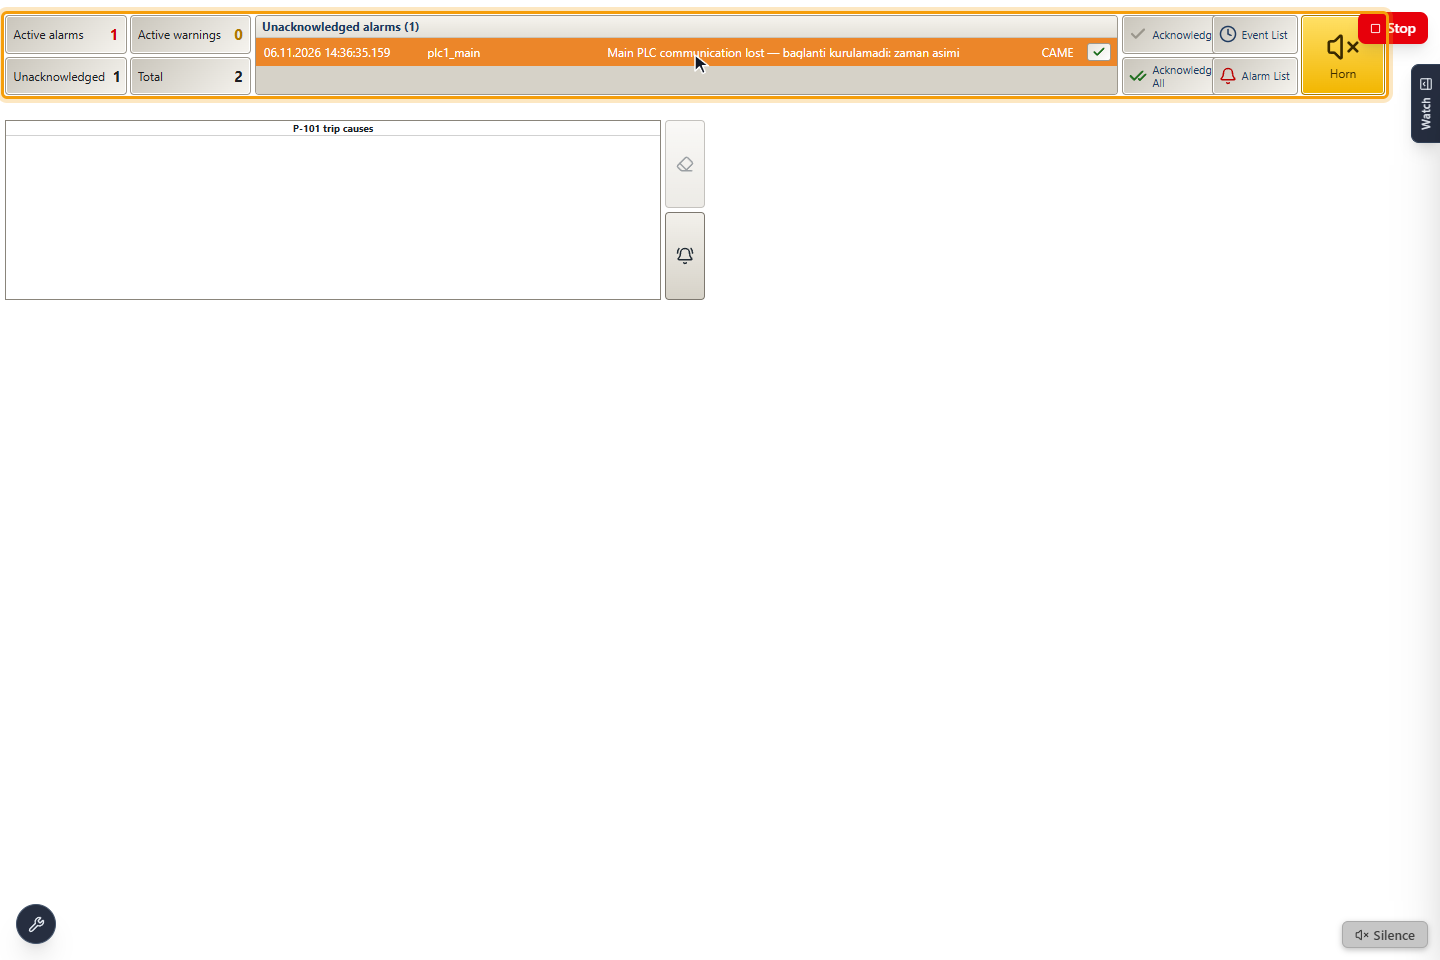
| Control | Effect |
|---|---|
| Click on a row | Selects the row. Ctrl + click adds or removes a row. |
| ✓ in a row | Acknowledges this alarm |
| Acknowledge | Acknowledges the selected alarms |
| Acknowledge all | Asks n alarms to acknowledge?, then acknowledges every unacknowledged alarm in the scope of the band. Click Yes or Cancel. |
| Event List | Opens the event list page |
| Alarm List | Opens the alarm list page with the unacknowledged alarms |
| Horn | Silences the horn and blinks while it sounds. The alarms stay unacknowledged. |
11. When a breaker opens
When the breaker open signal reaches its value, the unit has tripped. The band and the Trip causes list then show the opening and the causes, here Fault.
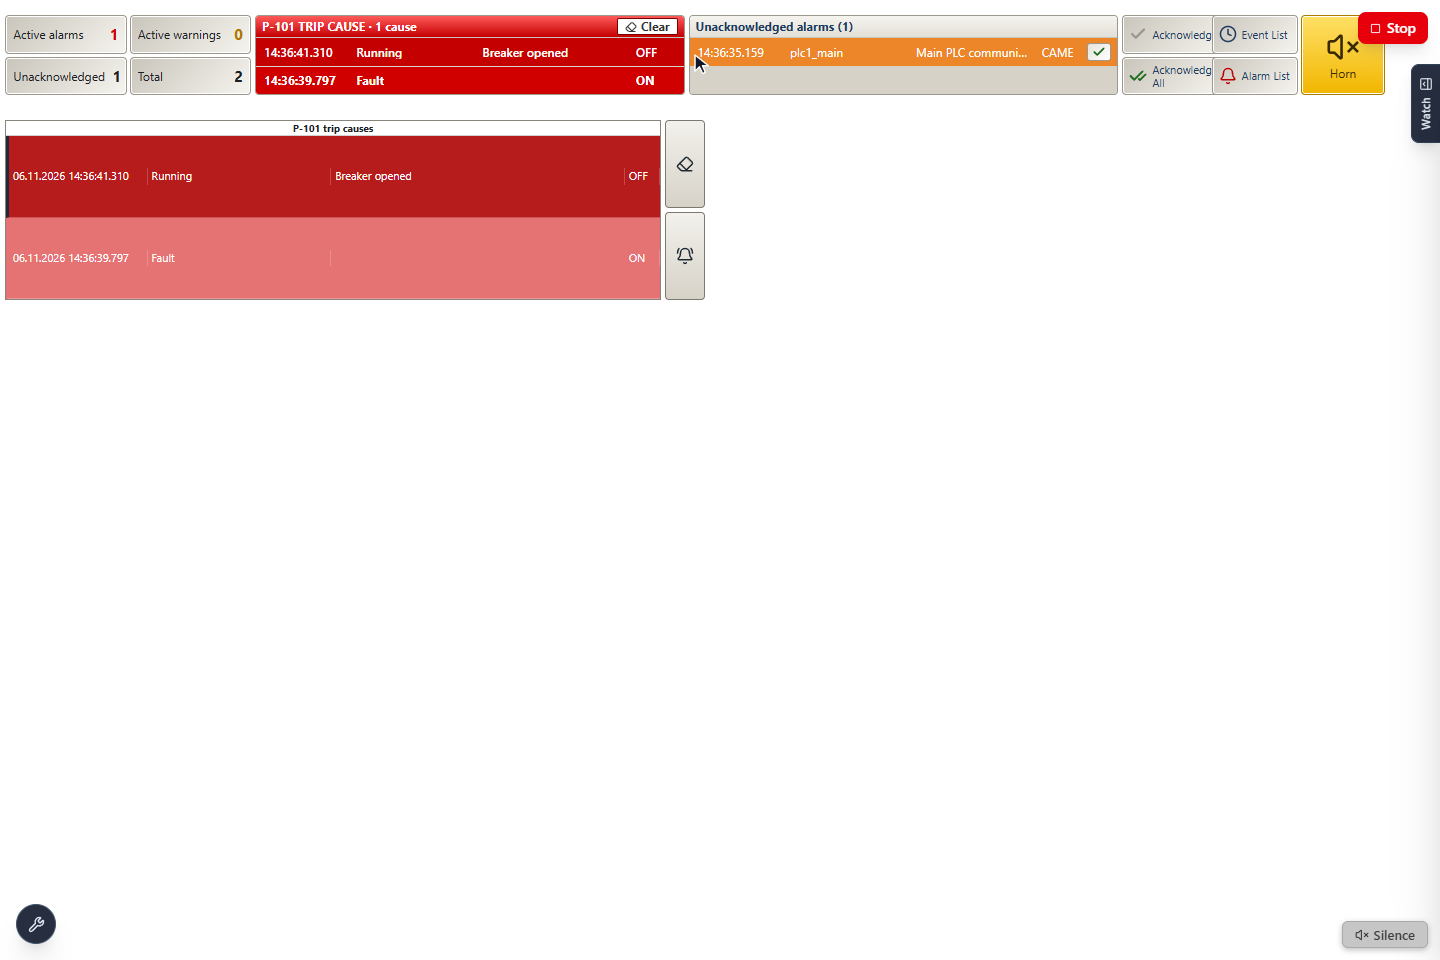
The causes follow these rules:
- A cause is the first time a cause signal became active (value
1) after the last clearing, up to the opening plus Tolerance (ms). - The cause nearest to the opening is the likely first cause. In Trip causes it is at the top and flashes. The pane of the band shows the opening first and then the causes, oldest first; all rows flash.
- If no cause came, the list says No cause signal was active before the breaker.
- YTCC searches the event history of the last 30 days, and the list refreshes every 3 seconds. Without an opening, the Trip causes list shows no rows.
The width of the band depends on how many units are open:
| Open units | The band shows |
|---|---|
| None | The unacknowledged alarms over the full width |
| One | The trip cause of the unit on the left, the unacknowledged alarms on the right |
| Two or more | The trip causes of the first two units. The unacknowledged alarms are in the counters only, which flash on a new alarm. |
The list is cleared in four ways:
- The breaker closes.
- Start signal (optional) of a Trip causes list reaches its value.
- You click Clear in the pane of the band.
- You click the eraser Clear the list (also cleared when the breaker closes) in Trip causes.
The two buttons need the acknowledge permission. Clearing is recorded as an operator event, applies to all stations and is kept after a restart. Objects with the same Clear key are cleared together. The bell button Open alarm page of Trip causes opens the chosen page.
12. Open alarms from a counter
Click a counter. The alarm list page opens with these alarms:
| Counter | Opens |
|---|---|
| Active alarms | Active alarms from the high threshold up, also acknowledged ones |
| Active warnings | Active alarms from the medium threshold up to the high threshold, also acknowledged ones |
| Unacknowledged | Only the alarms that await acknowledgement |
| Total | All active alarms, also acknowledged ones |
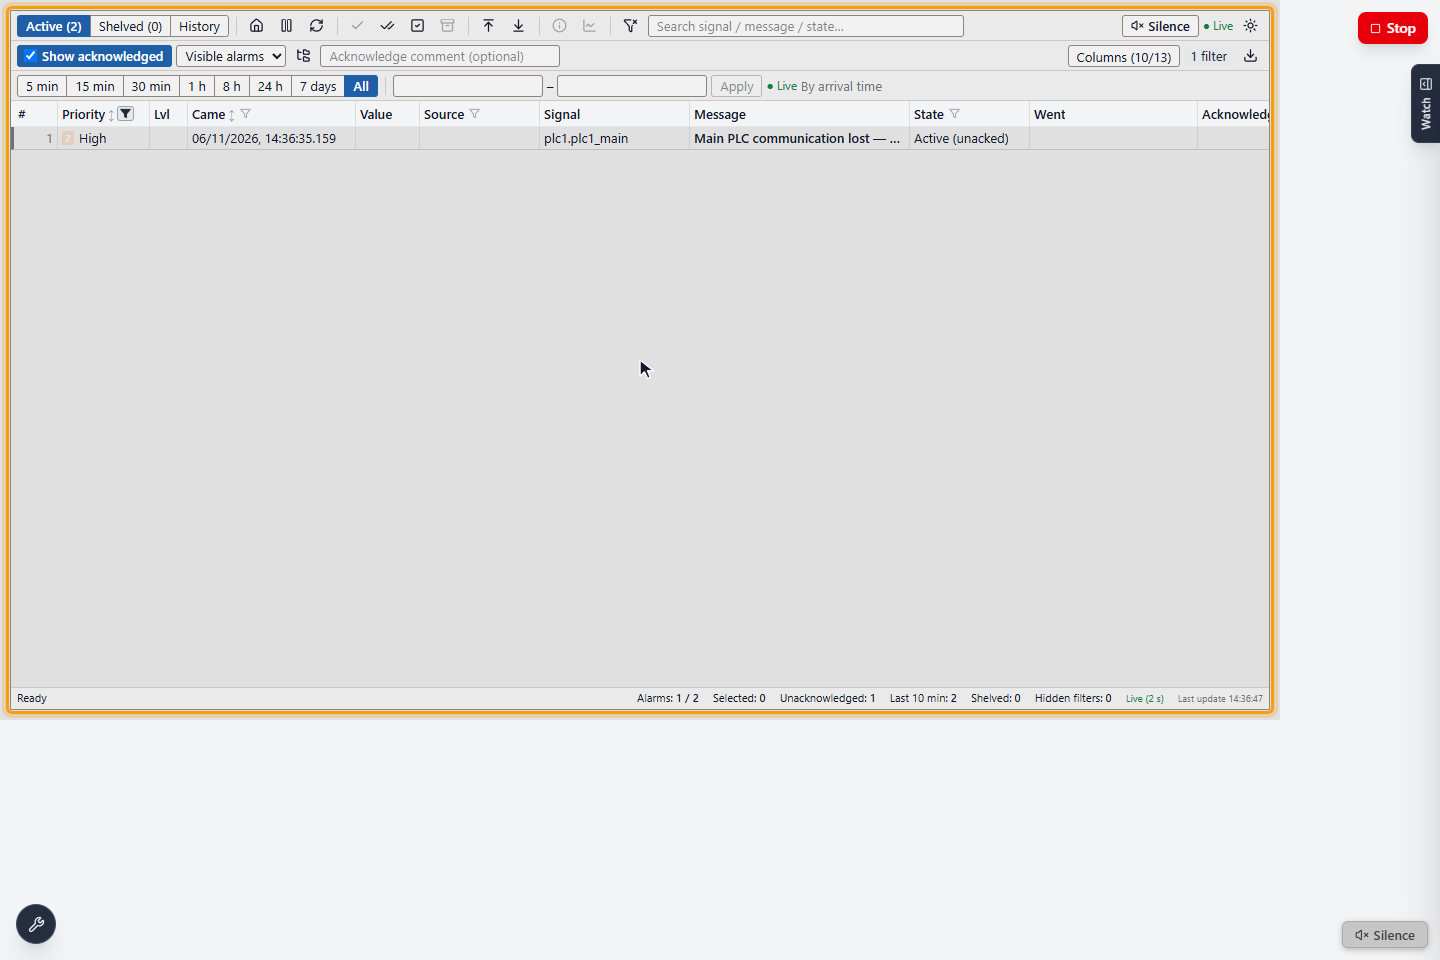
Status bar and number of rows of the alarm list
Two settings in the Appearance group of an Alarm List fit it into a small space, for example a strip of the latest alarms on an overview page:
| Setting | Default | Effect |
|---|---|---|
| Status bar | On | Off hides the bar at the bottom with the counters on the Active tab |
| Max rows (0 = all) | 0 | Shows at most this many rows of the active list, in the list's sort order |
The status bar comes back by itself on the other tabs and while there is an error or a message, for example when the alarm service cannot be reached. With Max rows set, Acknowledge visible acknowledges only the rows on the screen.
The card color
A card takes the color of the highest priority among its active alarms, and is green when the group has no open alarm. It blinks while an alarm of the group awaits acknowledgement.
The alarm bar of the runtime screen
The runtime screen shows an alarm bar at the bottom: the most urgent alarm awaiting acknowledgement, a chip per priority with the alarms awaiting acknowledgement and the total, and Silence while the horn sounds. A click opens the first page with an Alarm List. The operator can hide the bar with Alarm bar in the Settings menu of the runtime screen; the horn sounds anyway. See Read the alarm list and the alarm bar.
Good to know
- In the editor the objects show sample content: the list says Live list in run mode, the group shows Group A and Group B, and the band says Alarm band in runtime mode.
- Alarms without an area, such as communication, command and system alarms, are not in an area-scoped list.