Test run, live preview and watch
You do not have to open the runtime screen to see a page working. The live preview shows live values while you design, the Watch list follows chosen signals, and Run tries the page with clicks and commands inside the editor. A first walk-through is in Run the screen and watch a value.
Before you begin
- A page with objects is open in the screen editor.
- For live values the project is running.
Steps
1. Turn on the live preview
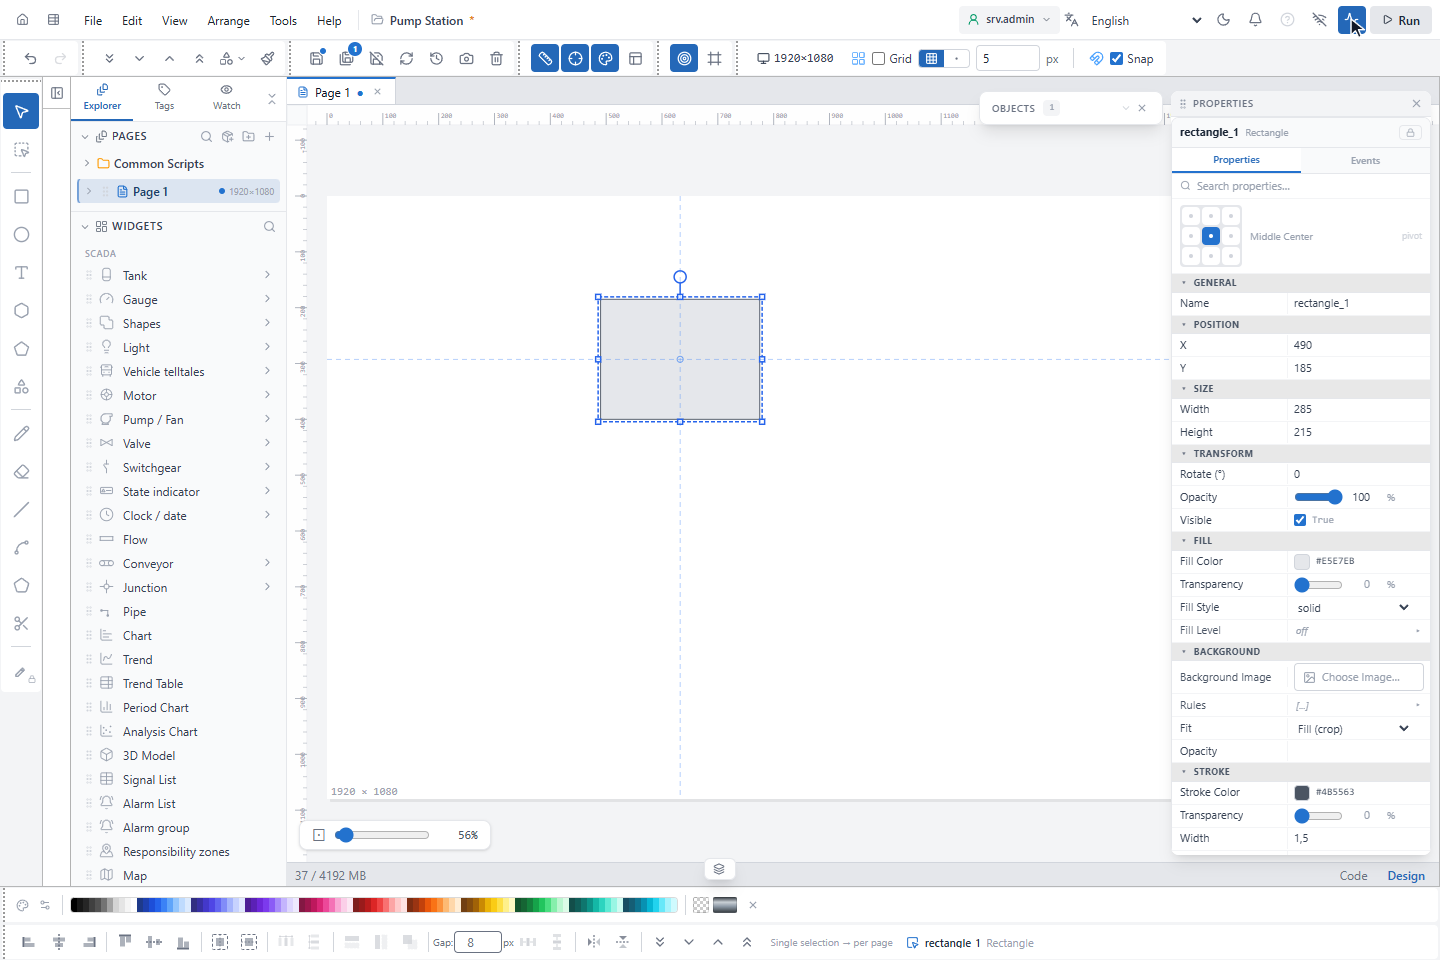
Click Live preview (the pulse icon left of Run). Bindings and rules are drawn with live values while you go on designing; objects hidden by a binding are shown faint. Clicks still select objects; nothing is written. The setting is remembered in this browser; it is off by default.
2. Watch signals
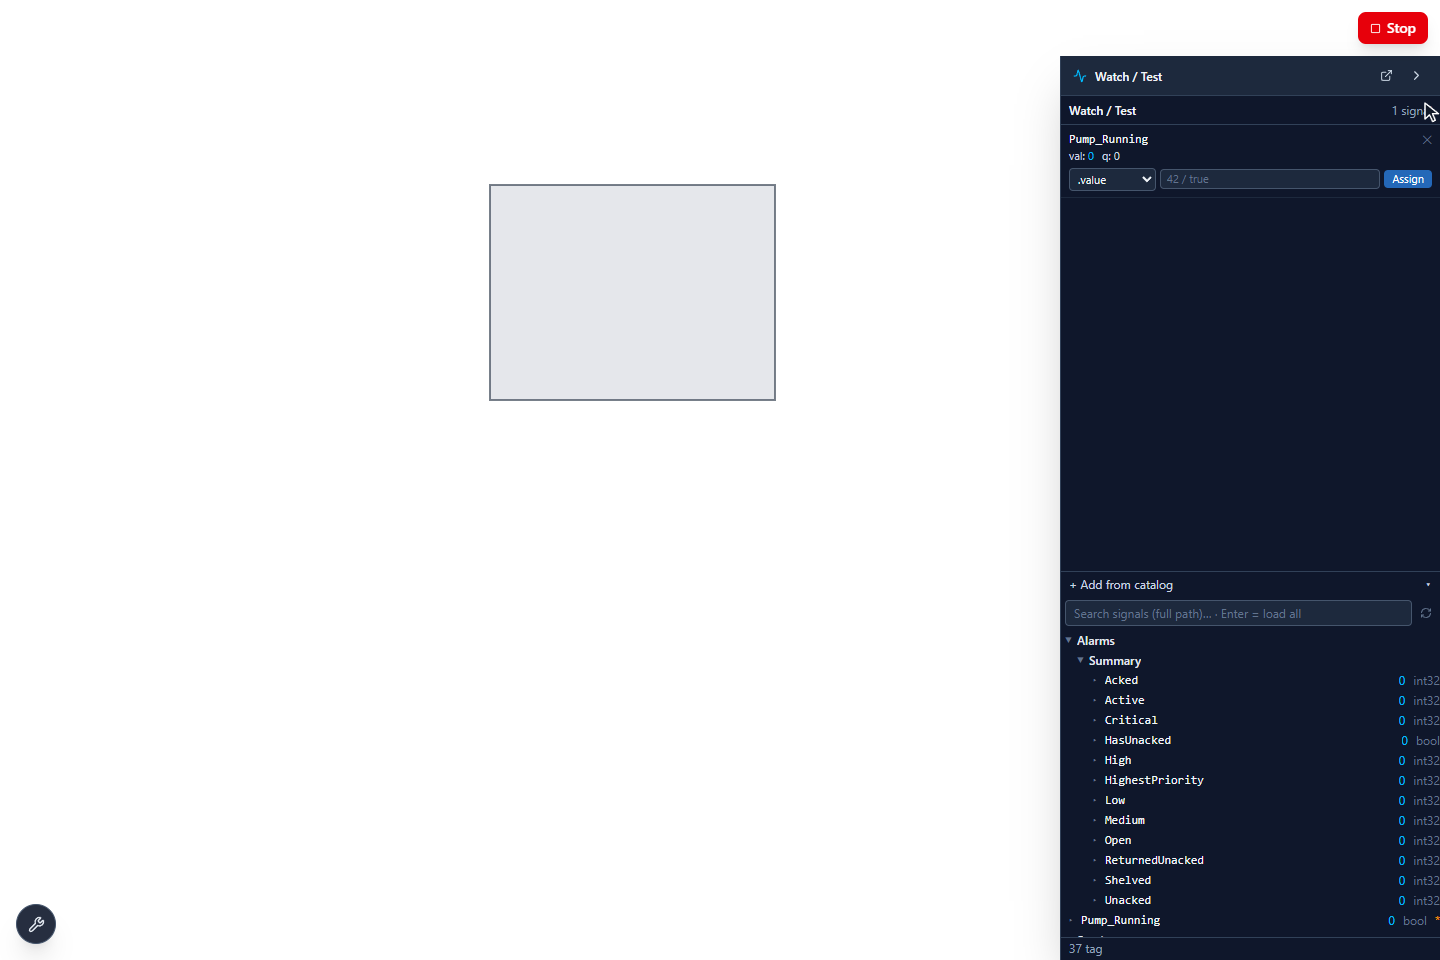
Click the Watch tab of the left panel. Click signals in + Add from catalog to add them; here Pump_Running.
Each row shows the signal, its value (val:) and its quality (q:, 0 = good). The list is kept per project in this
browser; ✕ removes a row.
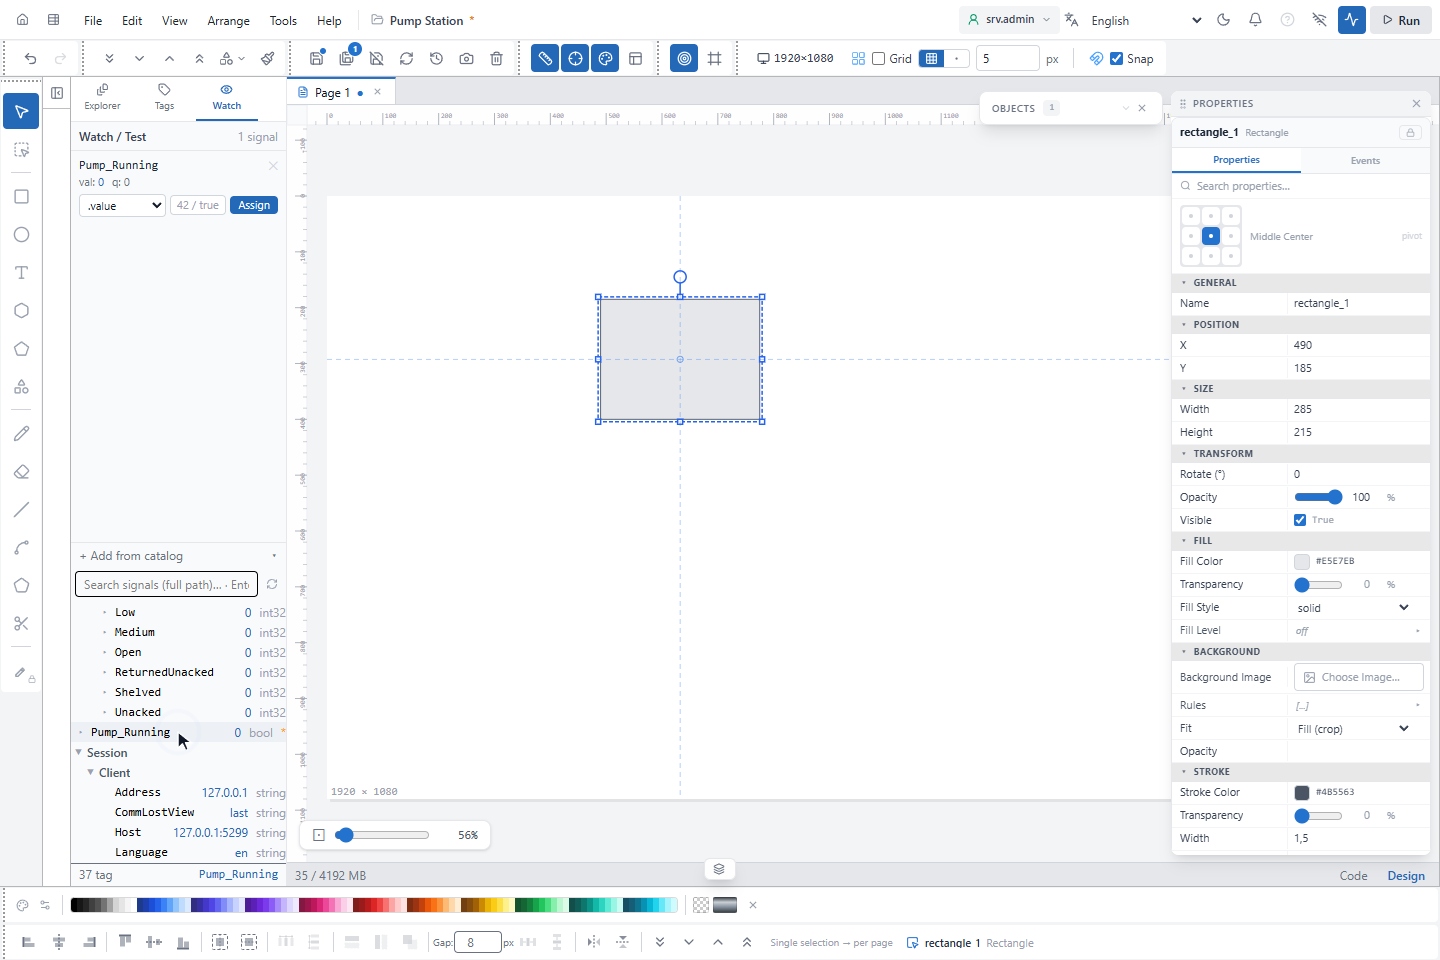
The value box with Assign puts a test value into the server's value cache without sending it to a device. It works only when the server allows test values (it is off by default), and with authentication only for users who may edit the project. Alarms and scripts react to a test value as to a real one.
3. Start the test run
Click Run. The panels disappear and the page works as on the runtime screen: values update, click actions run and inputs write. Stop at the top right, or Esc, goes back to the editor.
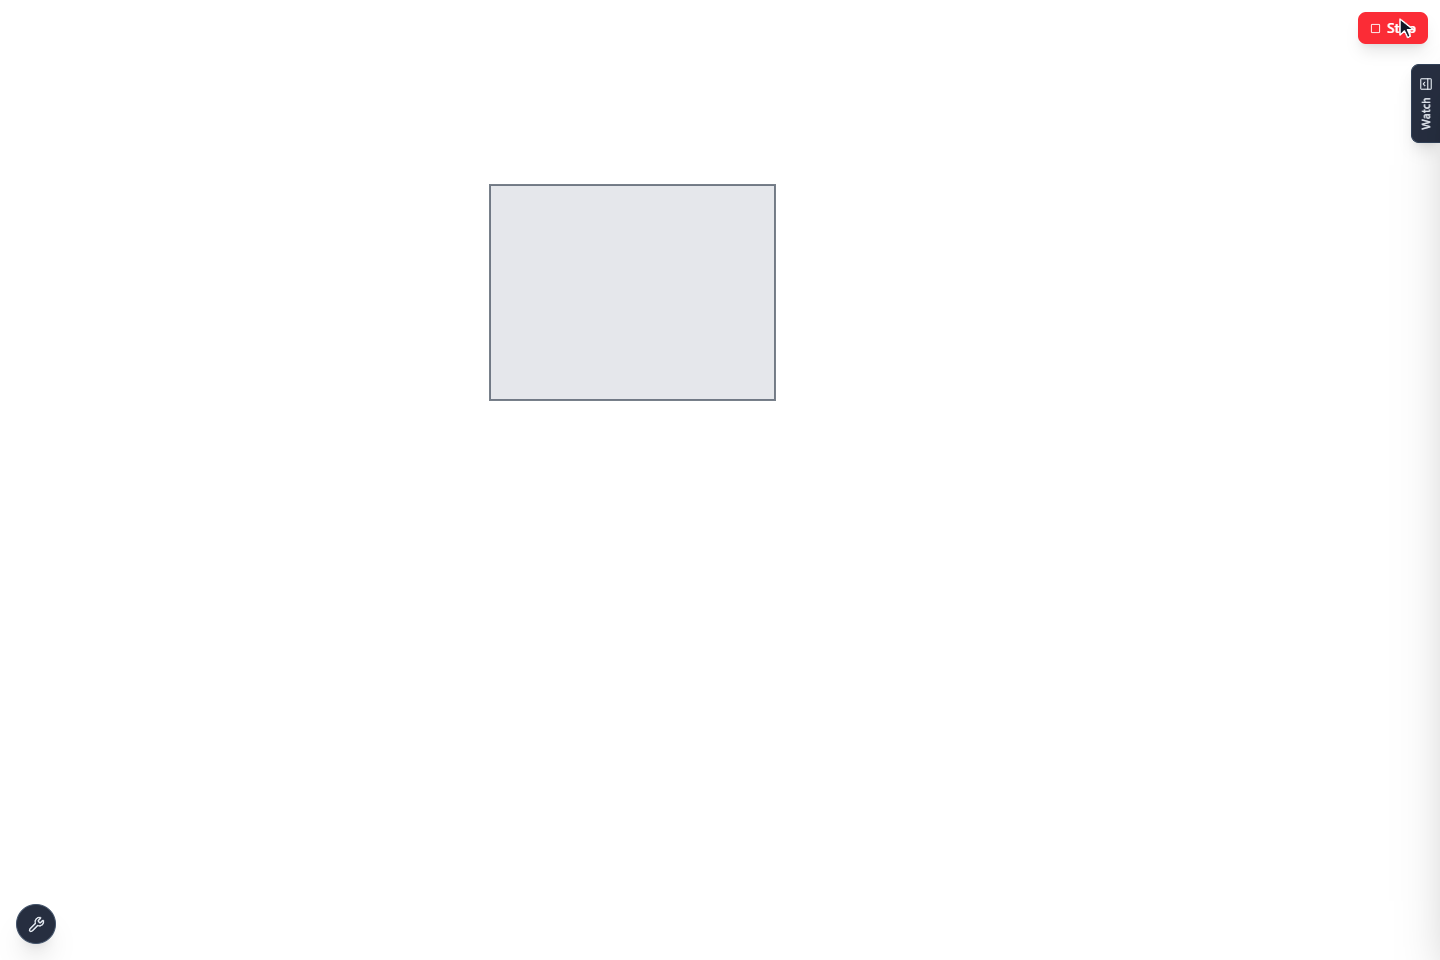
A test run sends real commands. When the project runs and objects are bound to signals of devices, a click writes to the device, with the same confirmations and approvals as on the runtime screen.
4. Open the test tools
Click the wrench at the bottom left. The Test tools menu has:
| Section | Contents |
|---|---|
| APPEARANCE | Zoom in and out, 1:1, fit, fill screen, Fullscreen |
| Page | A list of the pages, to switch page (projects with more than one page) |
| TEST | Watch panel, Open watch in a separate window, Alarm sound, Live data (connection state) |
| PREFERENCES | Menu position (four corners), Hide for this run, Back to editor |
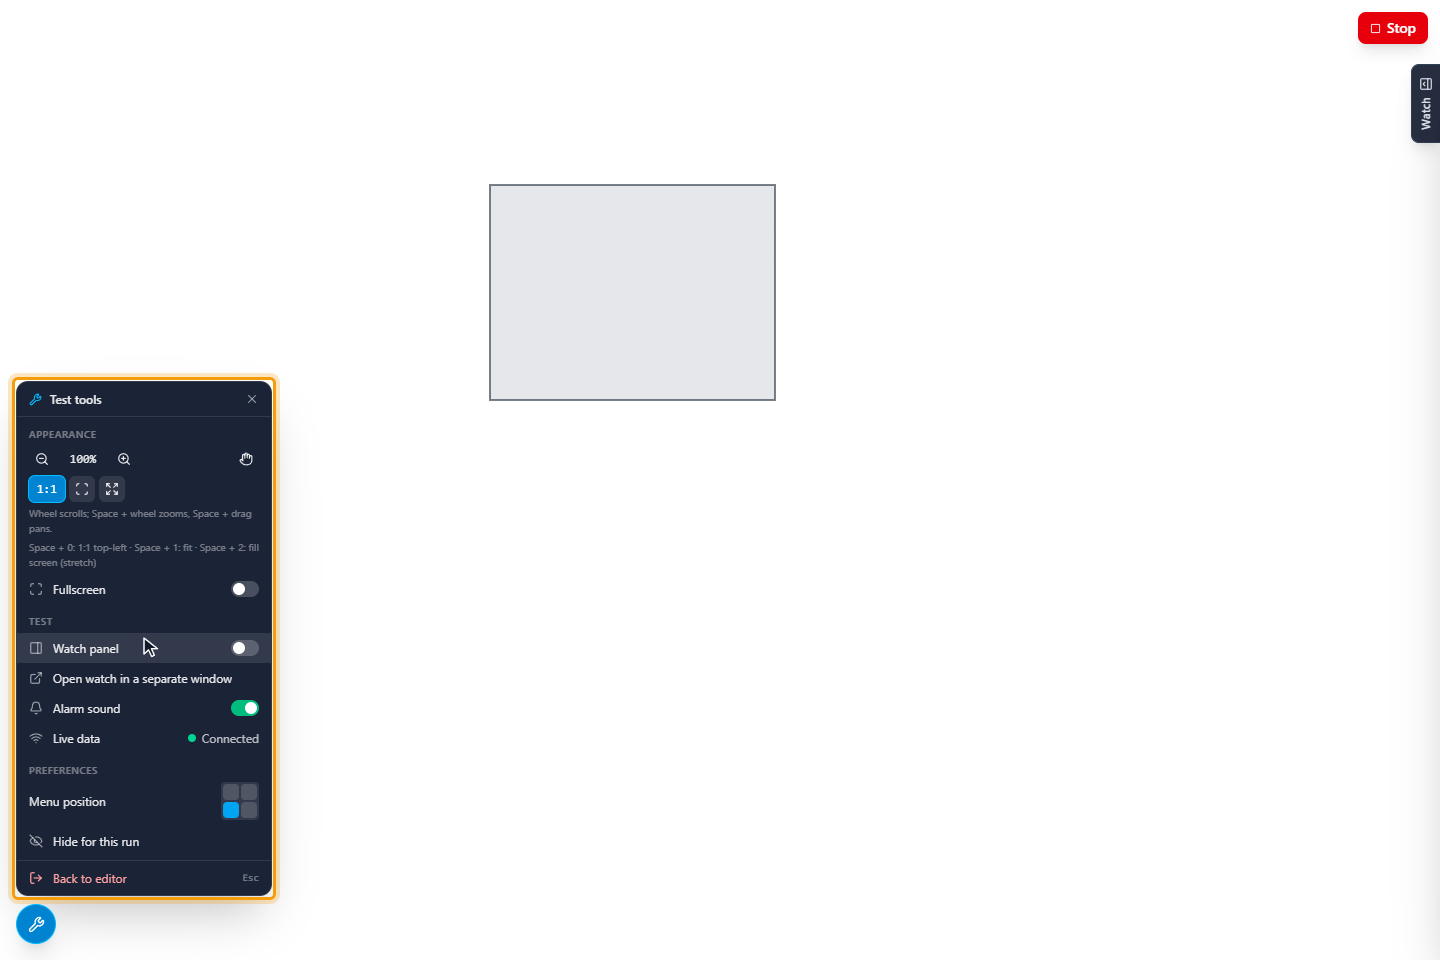
Drag the wrench to move it to another corner. After page changes the menu also lists the page switch times.
5. Watch during the run
Click the Watch tab at the right edge: the watch list opens as a drawer with the same signals. Drag its left edge to change its width. Where the browser supports it, the watch can open in a separate window that stays on top.
Test run and runtime screen
| Test run | Runtime screen | |
|---|---|---|
| Values, bindings, click actions, popups | Yes | Yes |
| Commands, confirmations, approvals | Yes, real | Yes |
| Layouts | Yes | Yes |
| Stop, wrench, watch drawer | Yes | No |
| Operator alarm bar and menus | No | Yes |
Layers that operators switch on and off start again from their design state at each run.
Keys in the test run
| Keys | Effect |
|---|---|
| Esc | Back to the editor (closes the wrench menu first when it is open) |
| Ctrl+=, Ctrl+- | Zoom in, zoom out |
| Space+0 | 1:1 |
| Space+1 | Fit |
| Space+2 | Fill the screen |
| Space + wheel, Space + drag | Zoom, pan |
Good to know
- Simulate communication loss previews the communication-lost colors in the design view (see Appearance without a value or communication).
- Alarm sound in the test tools switches the alarm sound of this browser, also outside the test run.