State tables
A state table maps the values of a signal to what the operator sees: 2 becomes a red Fault with a triangle, a
level above 80 % turns the gauge band amber. The table is set in the properties of the object.
Before you begin
- A page is open in the screen editor.
Steps
1. Fill the state table
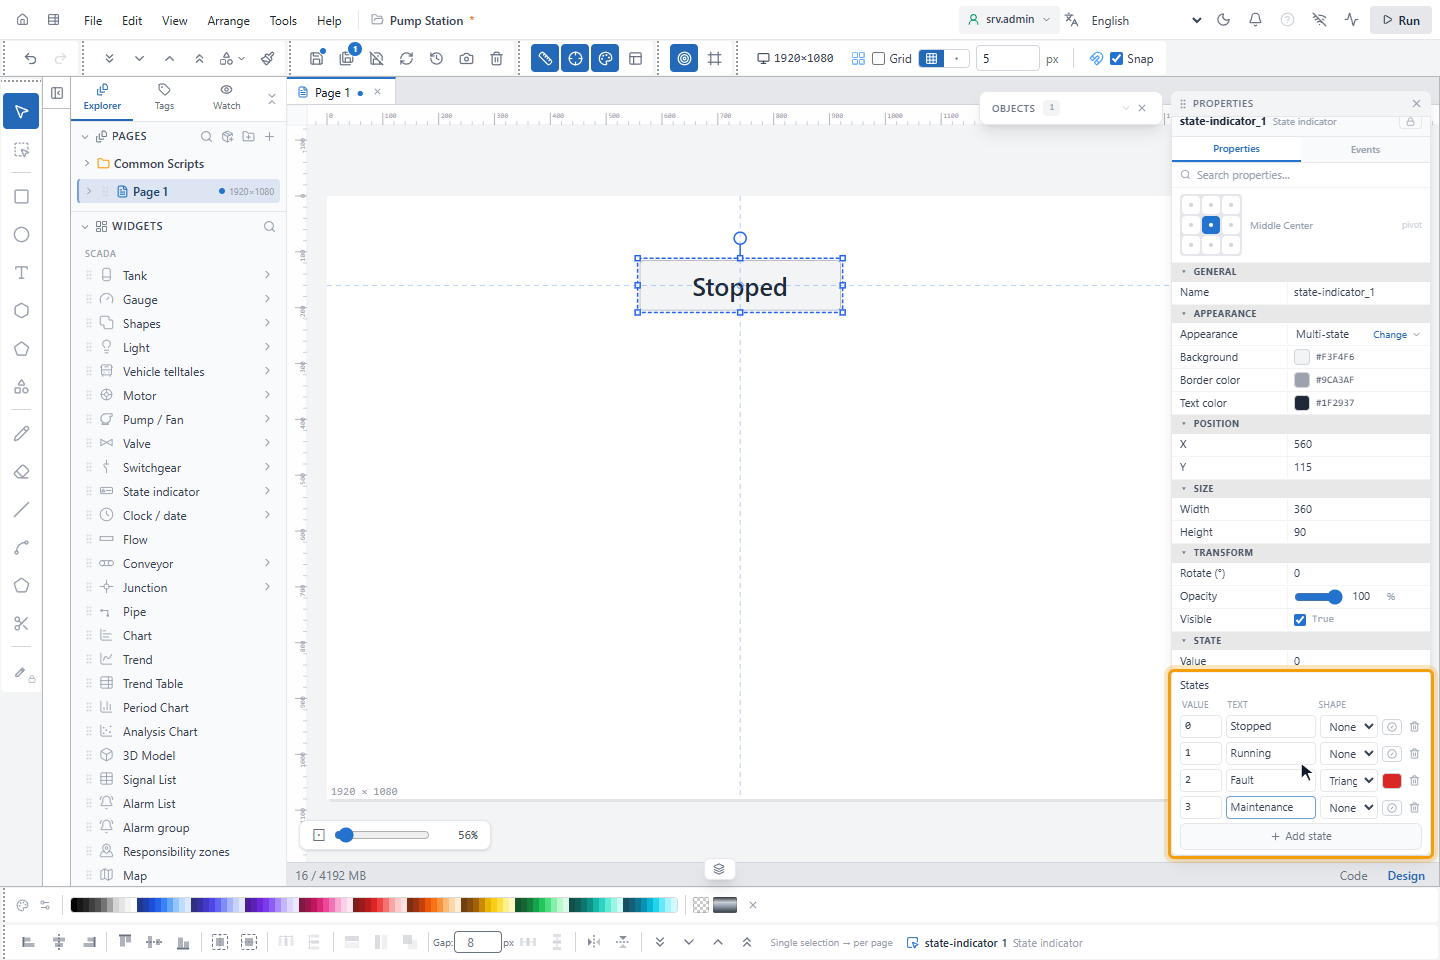
Click State indicator in the palette, pick Multi-state and draw it. The States table in the State group has one row per value:
| Column | Meaning |
|---|---|
| Value | The exact value, for example 0, 1, 2 or a text |
| Text | What the indicator shows |
| Shape | None, Circle, Square, Triangle or Diamond in front of the text |
| Color | The background; empty means neutral (the normal state) |
Add state adds a row with the next value; here 3 becomes Maintenance. The trash button deletes a row.
| Variant | Rows it starts with |
|---|---|
| Multi-state | 0 Stopped, 1 Running, 2 Fault (red, triangle) |
| Mode indicator | 0 AUTO, 1 MAN, 2 LOCAL, 3 CAS |
A colored row draws its color as the background with readable text; a neutral row is grey with dark text.
2. Try a value
Bind Value to the signal, or type a value to try the table; here 2. The indicator shows Fault in red with the
triangle.
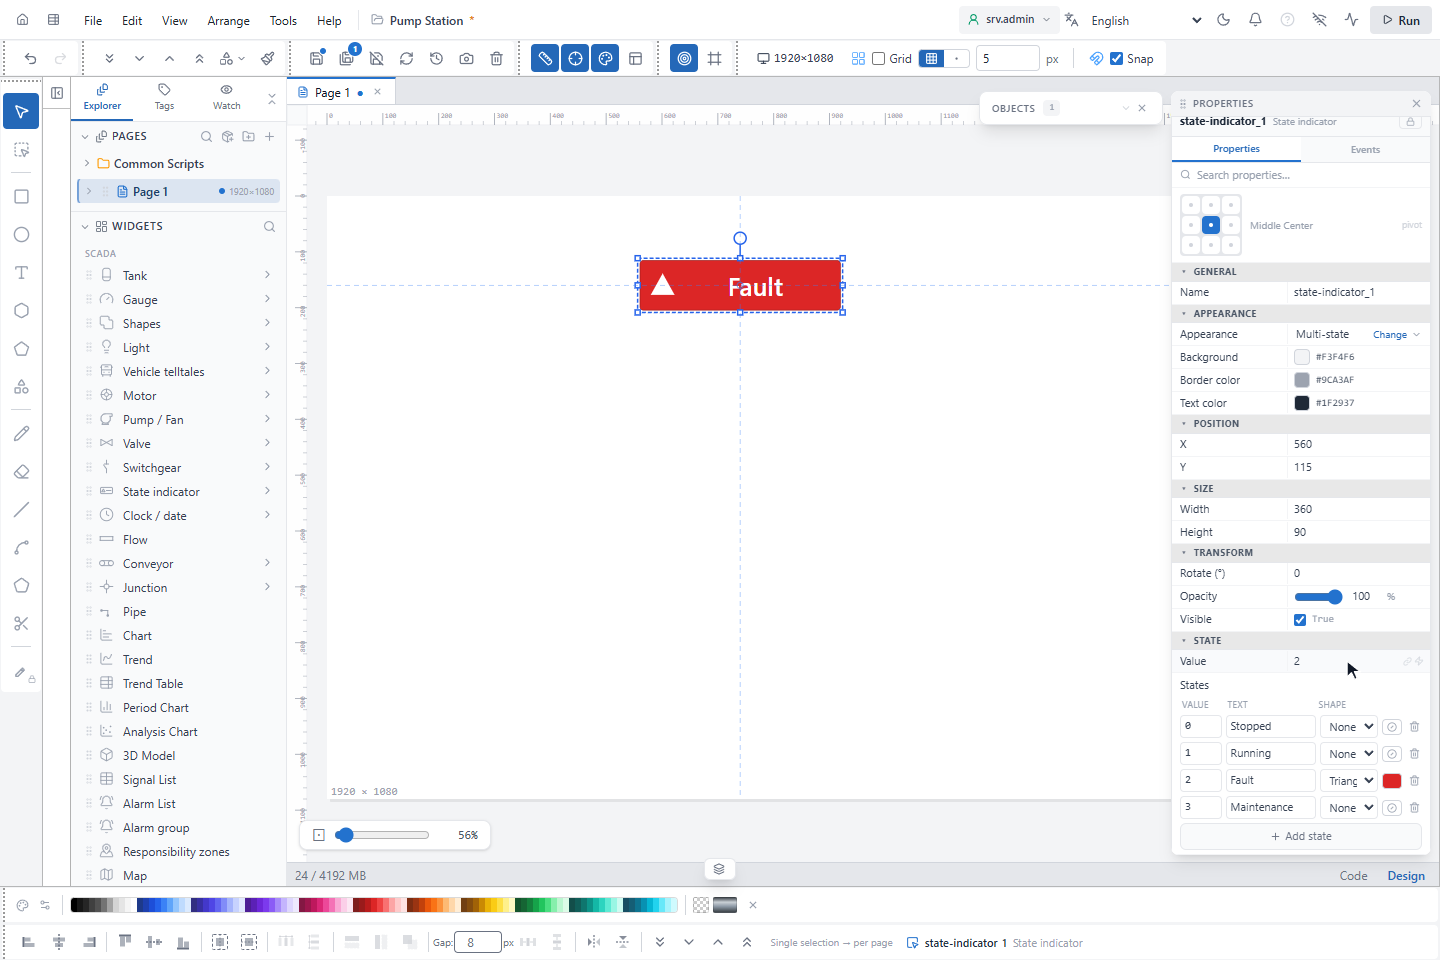
The first row whose value matches is used. Numbers are compared as numbers (1.0 matches 1), and true and
false match the rows 1 and 0. A value that matches no row shows Text for unmatched value (? by default);
while the first value is awaited the indicator shows … with a dashed border.
3. Color the zones of a gauge
Select a gauge. In the Color zones group click Add zone for each zone and enter Start and End, here 0–80 and 80–100, then pick the color of each zone. A new zone starts where the previous one ends and is grey until you choose a color.
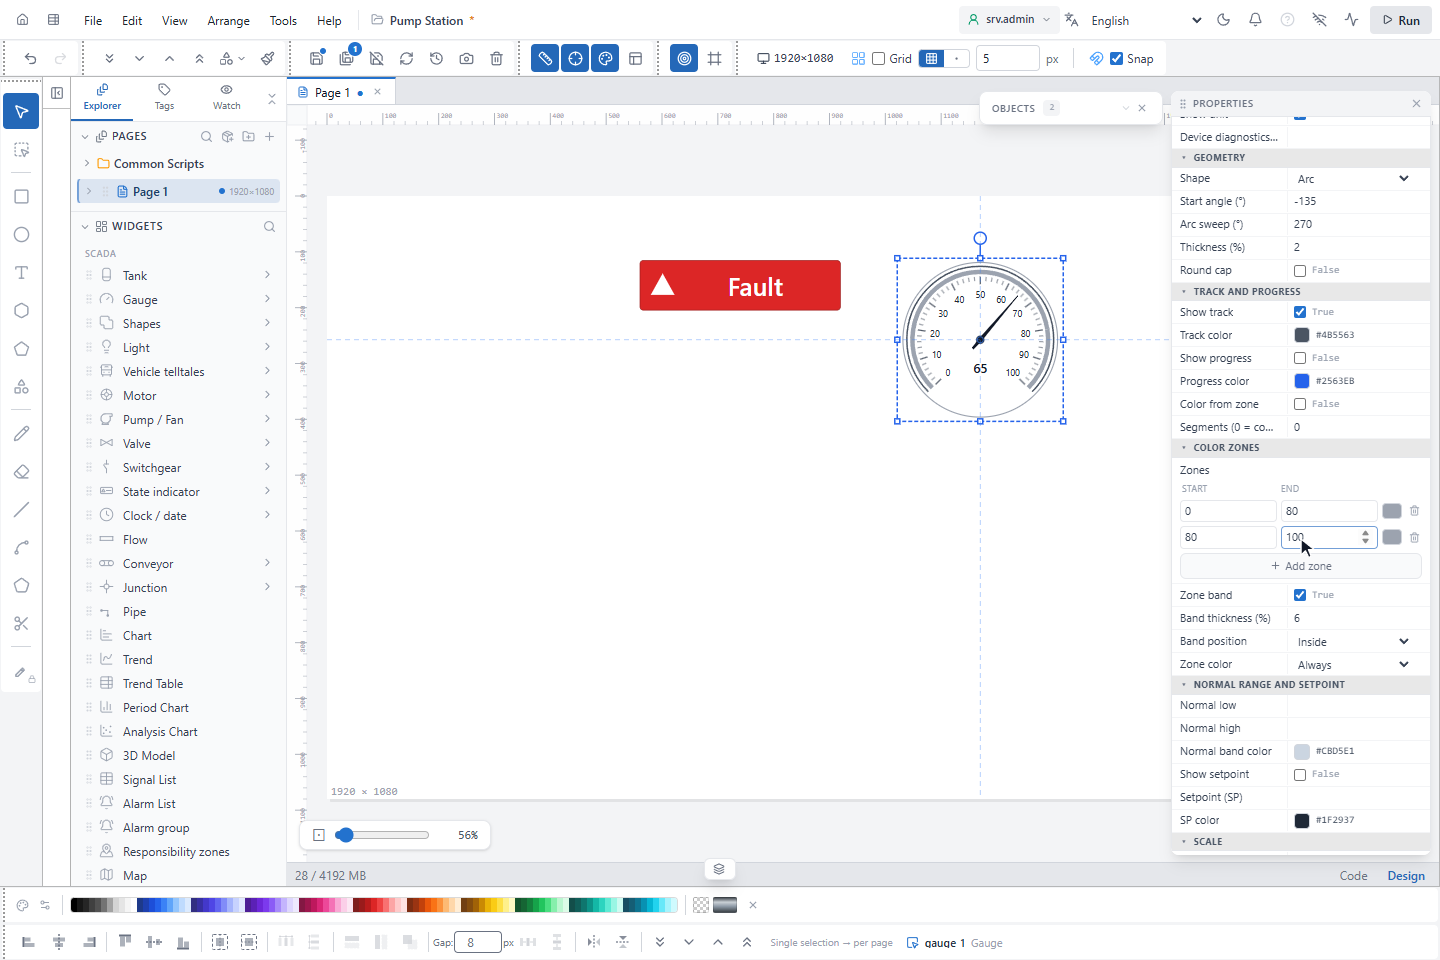
Zone color decides when the zones are colored: Always, or Only while the value is inside (ISA-101), which keeps the band neutral until the value enters a zone. Zone band, Band thickness (%) and Band position set how the band is drawn; Color from zone in Track and progress colors the progress bar with the zone of the value.
Images that change with a signal
An Image shows a different picture per state with Rules in its Content group (also for the background image of shapes). The button opens the Signal picker first; after you bind the signal, Edit mapping opens the Tag Binding window: on the Value tab each case gets a picture, by Equality or by Range (from the lower value up to, not including, the upper value); Bit gives one picture for 1 and one for 0. If no match (default) and Unavailable / Bad set the picture when nothing matches or the signal has no usable value.
Good to know
- When two rows match, the upper one wins.
- Blinking is set in the Animation group, not in the state table (see Animation).
- Zone bounds are included at both ends; the first matching zone wins.