A tour of the configuration editor
The configuration editor is where you define what YTCC communicates with and what it keeps: signals, drivers and devices, alarms, history, areas and zones, server scripts and users. This page walks through its parts.
Before you begin
- The project exists. To open the configuration editor, right-click the project on the home page and choose Configuration editor, or click the Configuration editor button in the toolbar of the screen editor. The editor opens in its own browser tab; if a tab is already open for the project, YTCC switches to it.
Steps
1. Find your way around the window
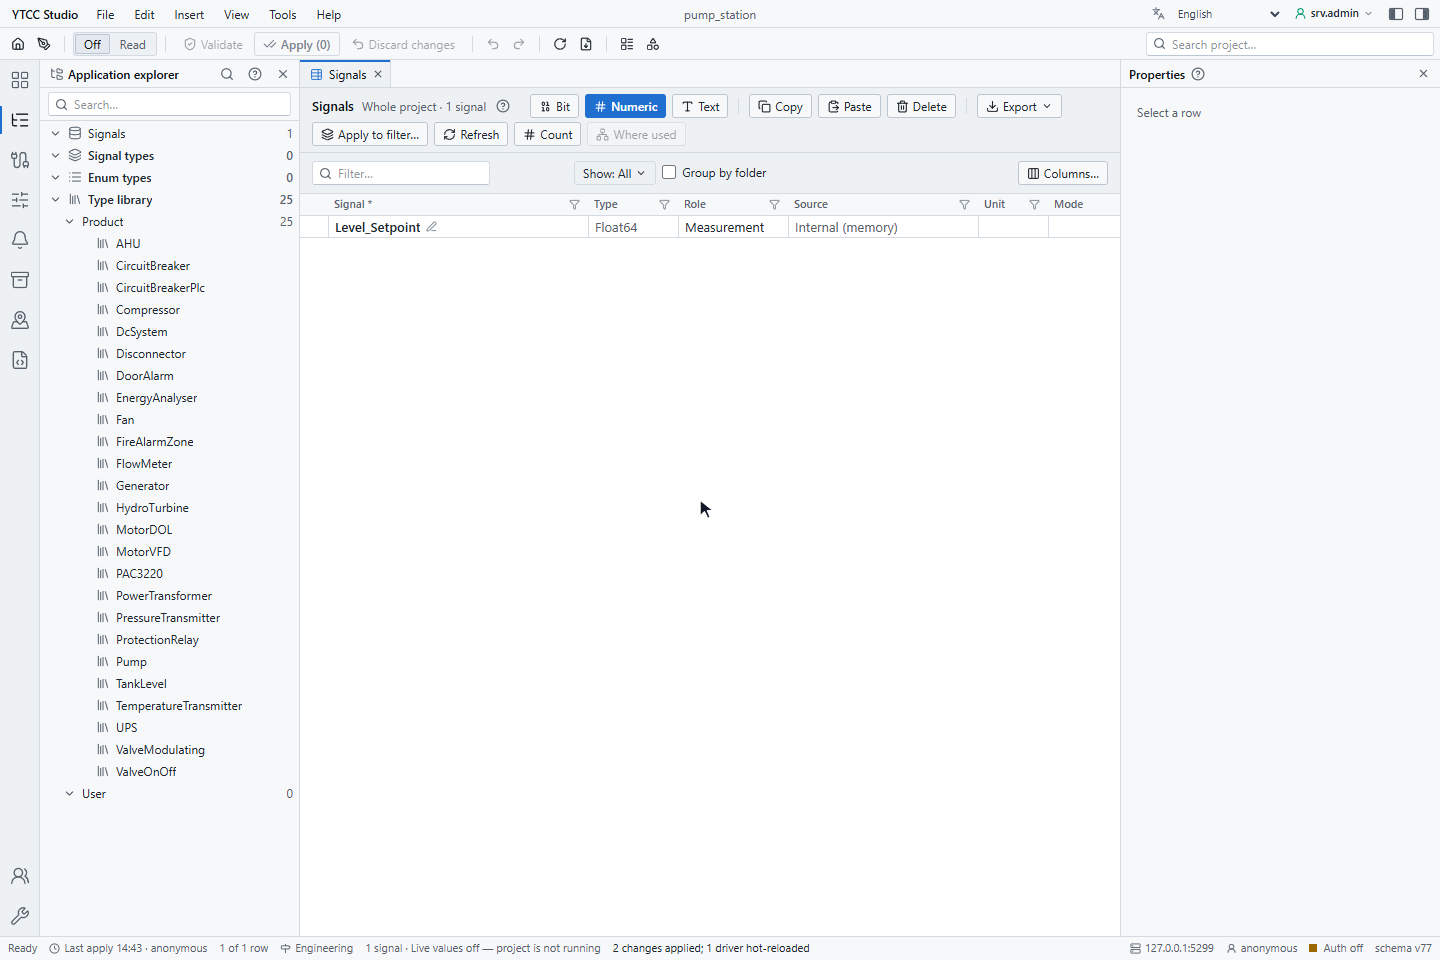
From top to bottom the window has:
- the title bar with YTCC Studio, the menu bar, the project name, the session button with the signed-in user, and two buttons that show or hide the explorer (Ctrl+B) and the Properties panel (Ctrl+I);
- the toolbar: back to the home page and to the screen editor, the live data switch (Off, Read, Read-Write), Validate, Apply (n), Discard changes, undo and redo, refresh, export and the type commands, and the Search project… box at the right;
- the activity bar at the far left, the explorer next to it, the open views in tabs in the middle and the Properties panel at the right;
- the status bar at the bottom.
2. Use the menu bar
| Menu | Holds |
|---|---|
| File | Validate, Apply (Ctrl+S), Discard changes, Import / export, Restore point…, Import…, Export…, Back to Home, Drawing editor, Close tab |
| Edit | Undo (Ctrl+Z), Redo (Ctrl+Y), Copy, Paste, Paste values, Duplicate (Ctrl+Shift+D), Fill down (Ctrl+D), Copy properties, Paste properties, Select all, Edit cell (F2), Edit… (Enter), Delete, Rename, Find and replace… (Ctrl+H) |
| Insert | Bit signal, Numeric signal, Text signal, Signals from type… |
| View | Explorer, Properties panel, Help panel, Search project, Theme, Language, Live data, a list of all views (Areas, Instances, Internal tags, Signal settings, Drivers → devices, Address bindings, Alarms · Classes, Alarm groups, Responsibility zones, Historian, Server scripts) and Refresh (F5) |
| Tools | Signal types…, Enum types…, Type library…, Import type from project…, Diagnostics, Audit, Archive tables…, Communication check…, Color database…, AI access (MCP)…, Options… |
| Help | Field help (Shift+F1), Keyboard shortcuts (F1), About |
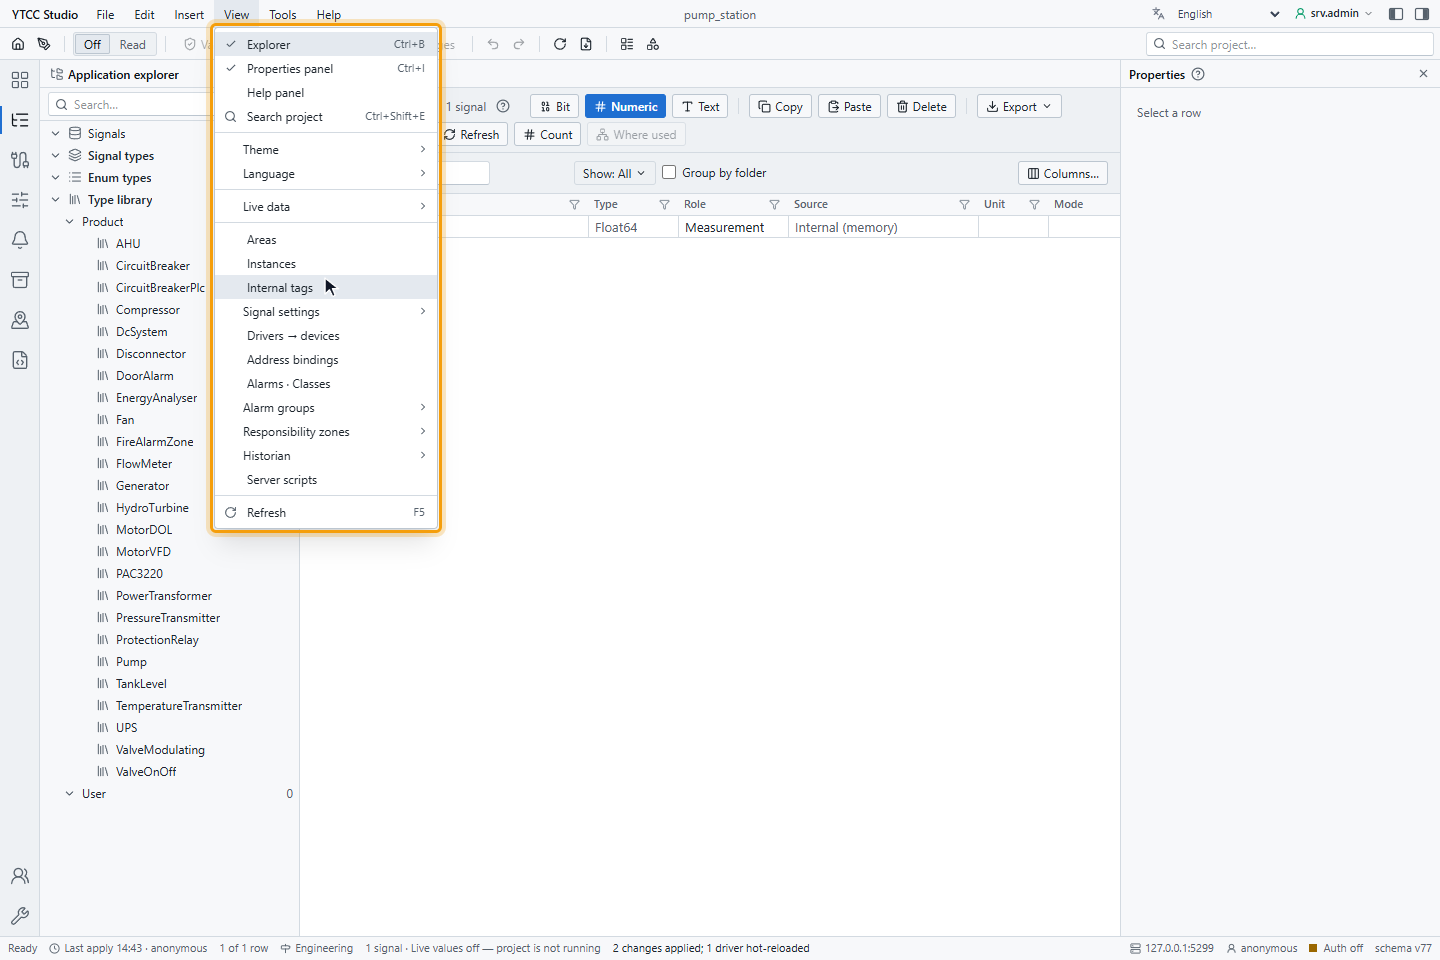
Press Alt or F10 to move to the menu bar with the keyboard; the arrow keys move between the menus. A greyed-out command is not available at the moment, for example Apply when there is nothing to apply. Theme is a setting of the configuration editor in this browser: it has its own Dark theme, Light theme or System choice, dark by default, independent of the rest of YTCC. Language is the same setting as on the home page; a short language list is also in the title bar, next to the session button.
3. Switch between work areas
The icons of the activity bar group the views. Point at an icon to see its name and what it holds. Click an icon to show its views in the explorer and open the first one; click the active icon again to hide or show the explorer. The shortcuts are Alt+1 to Alt+9 and Alt+0.
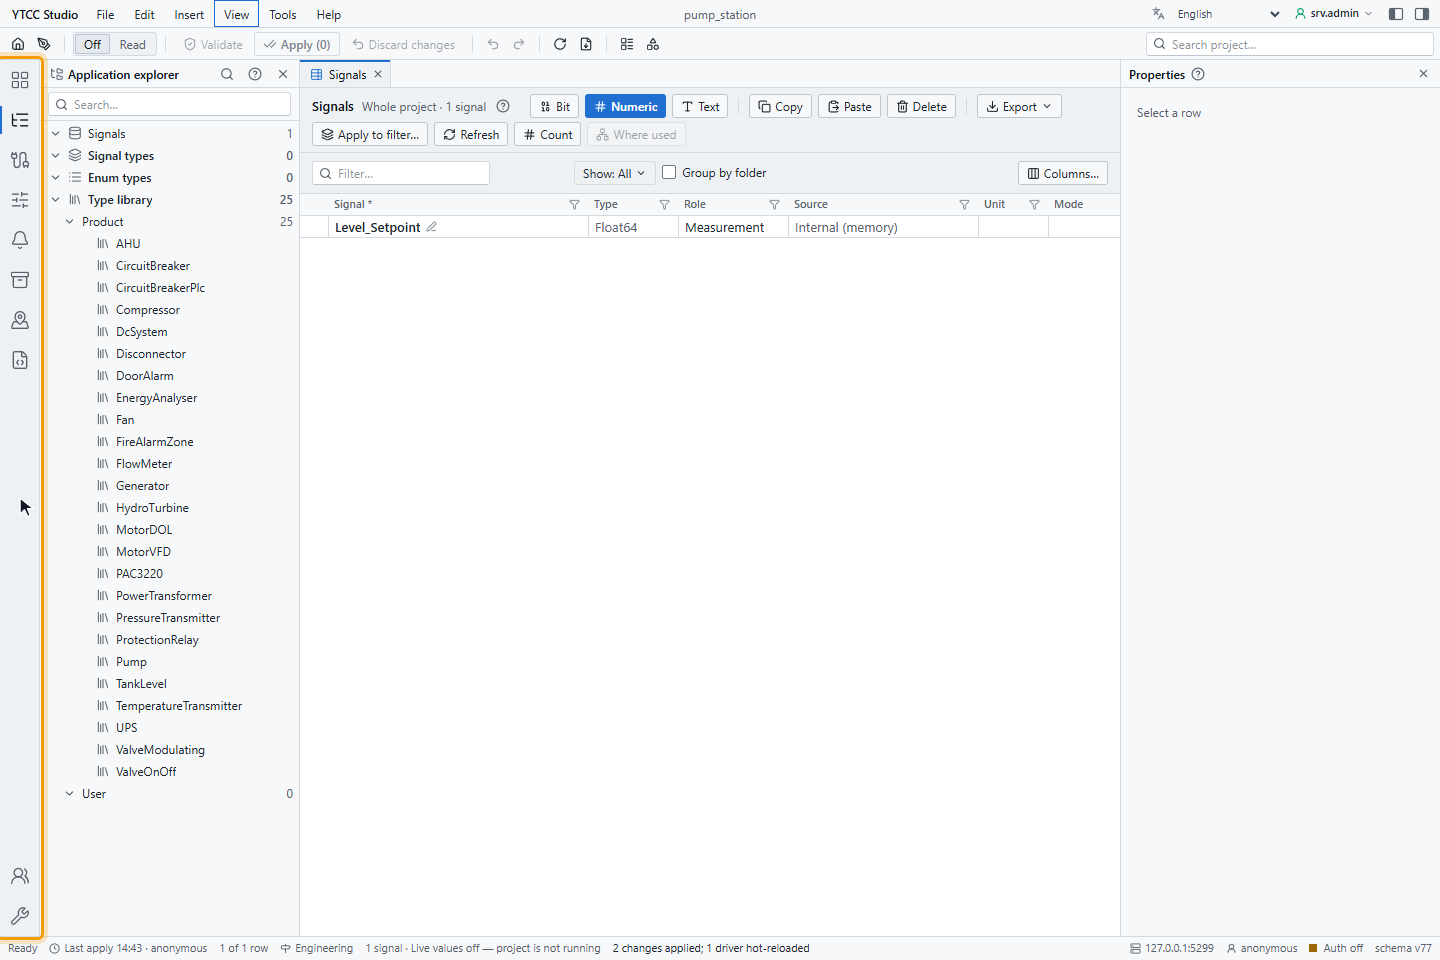
| Key | Area | Holds |
|---|---|---|
| Alt+1 | All | All screens in one list |
| Alt+2 | Signals | Folders, signals, types, enums, library |
| Alt+3 | Drivers | Drivers, devices, address bindings |
| Alt+4 | Signal settings | Instances, value processing, write range, command settings |
| Alt+5 | Alarms | Alarm definitions, classes, alarm groups |
| Alt+6 | Historian | Archive tables, assignments, historian settings |
| Alt+7 | Areas and zones | Areas, responsibility zones, assignments |
| Alt+8 | Automation | Server scripts, internal tags |
| Alt+9 | Users | Profiles, users, policies, server administrators, audit log |
| Alt+0 | Tools | Diagnostics, import / export, audit log, AI access |
The editor remembers the last area you used.
4. Open views in tabs
The explorer shows the views of the chosen area. For Signals it is the Application explorer: the tree of signal folders, Signal types, Enum types and the Type library, with a Search… box. For the other areas it is a list of views. Each view you open gets a tab; the tabs can be reordered by dragging and closed with × or a middle click.
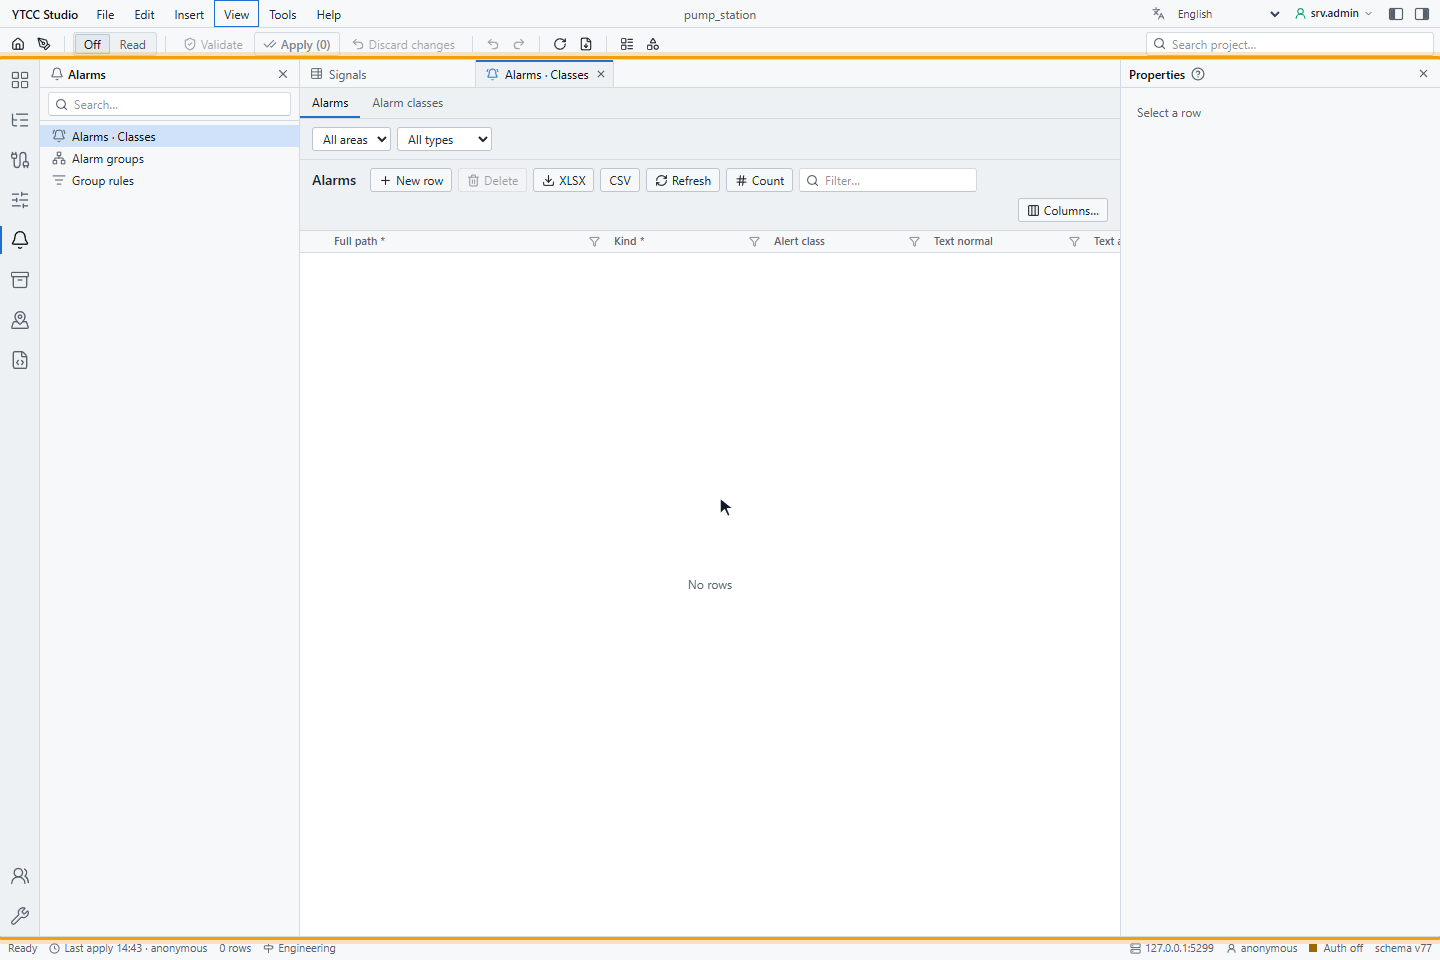
All tabs share one list of pending changes, so you can change several views and apply them together.
5. Read the Properties panel
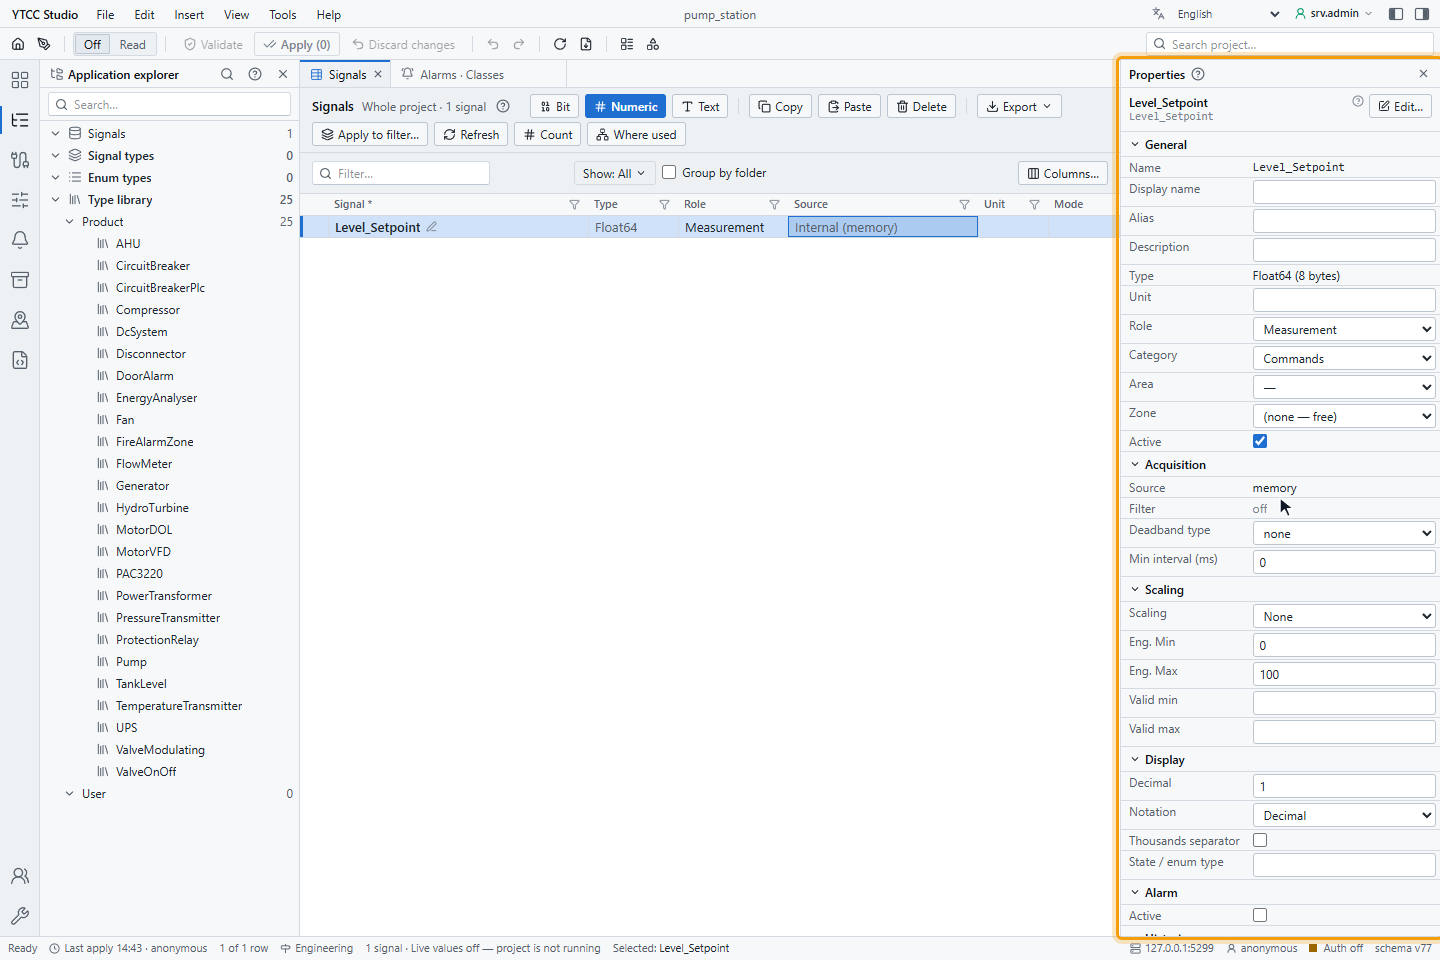
Select a row to see all its properties in the Properties panel. For a signal they are grouped into General, Acquisition, Scaling, Display, Alarm and the following groups. Edit… opens the full Signal properties window.
6. Watch live values
The live data switch in the toolbar sets whether the views show the current values from the running project:
- Off: no live values.
- Read: the Value, Quality and Mode columns show the current values.
- Read-Write: values can also be written from the editor. It is offered only to users who may write live values.
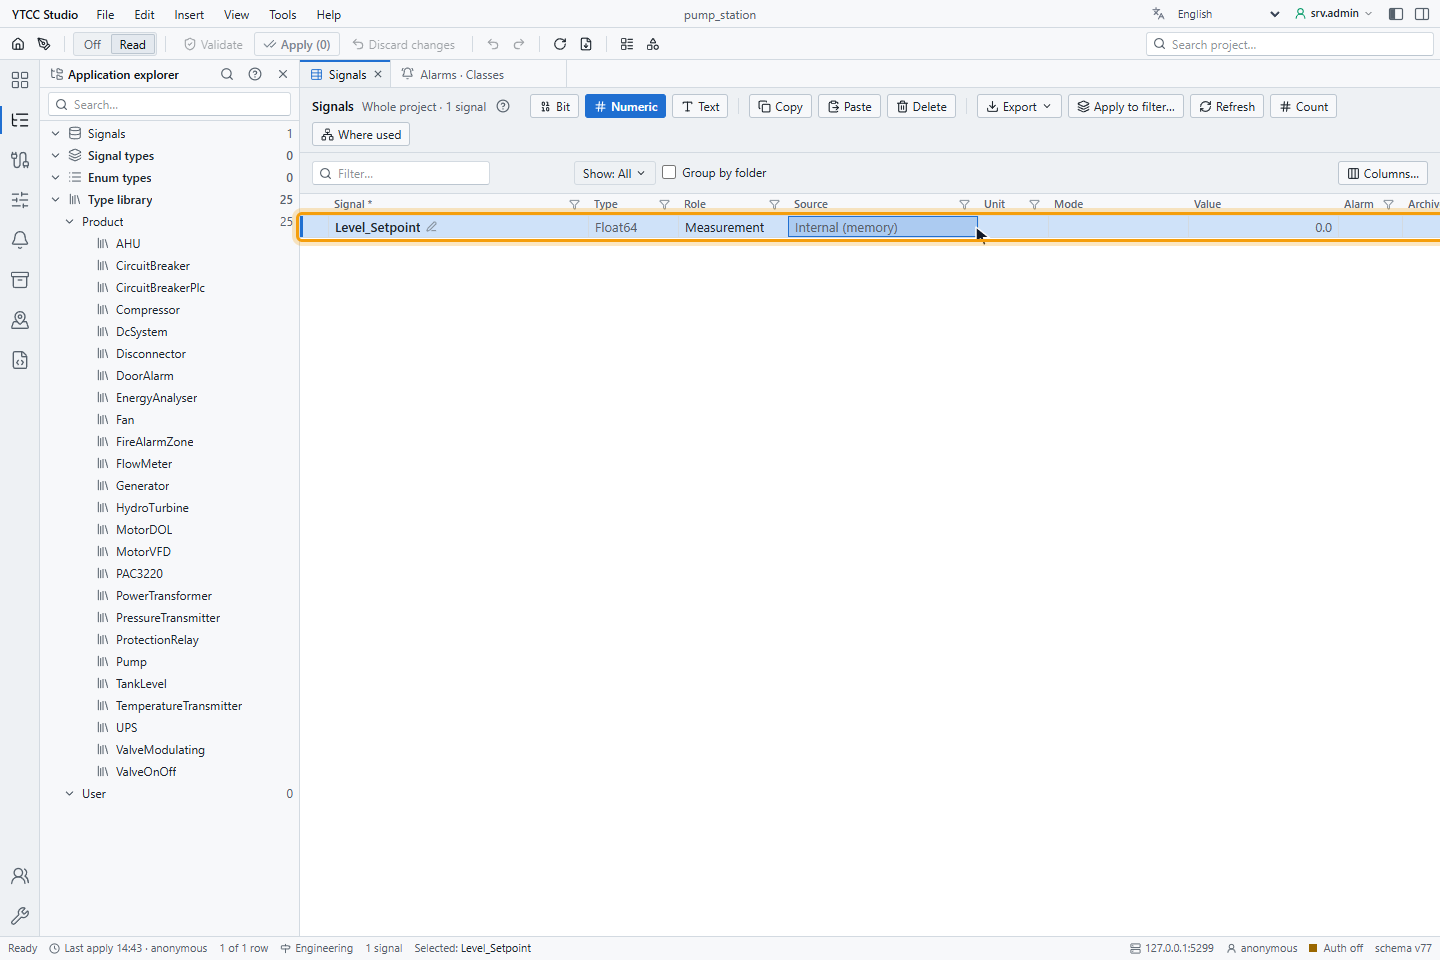
Live values need the project to be running. While it is not, the status bar says Live values off — project is not running. Ctrl+Shift+L switches live data on and off; Tools › Options… sets the mode the editor starts with.
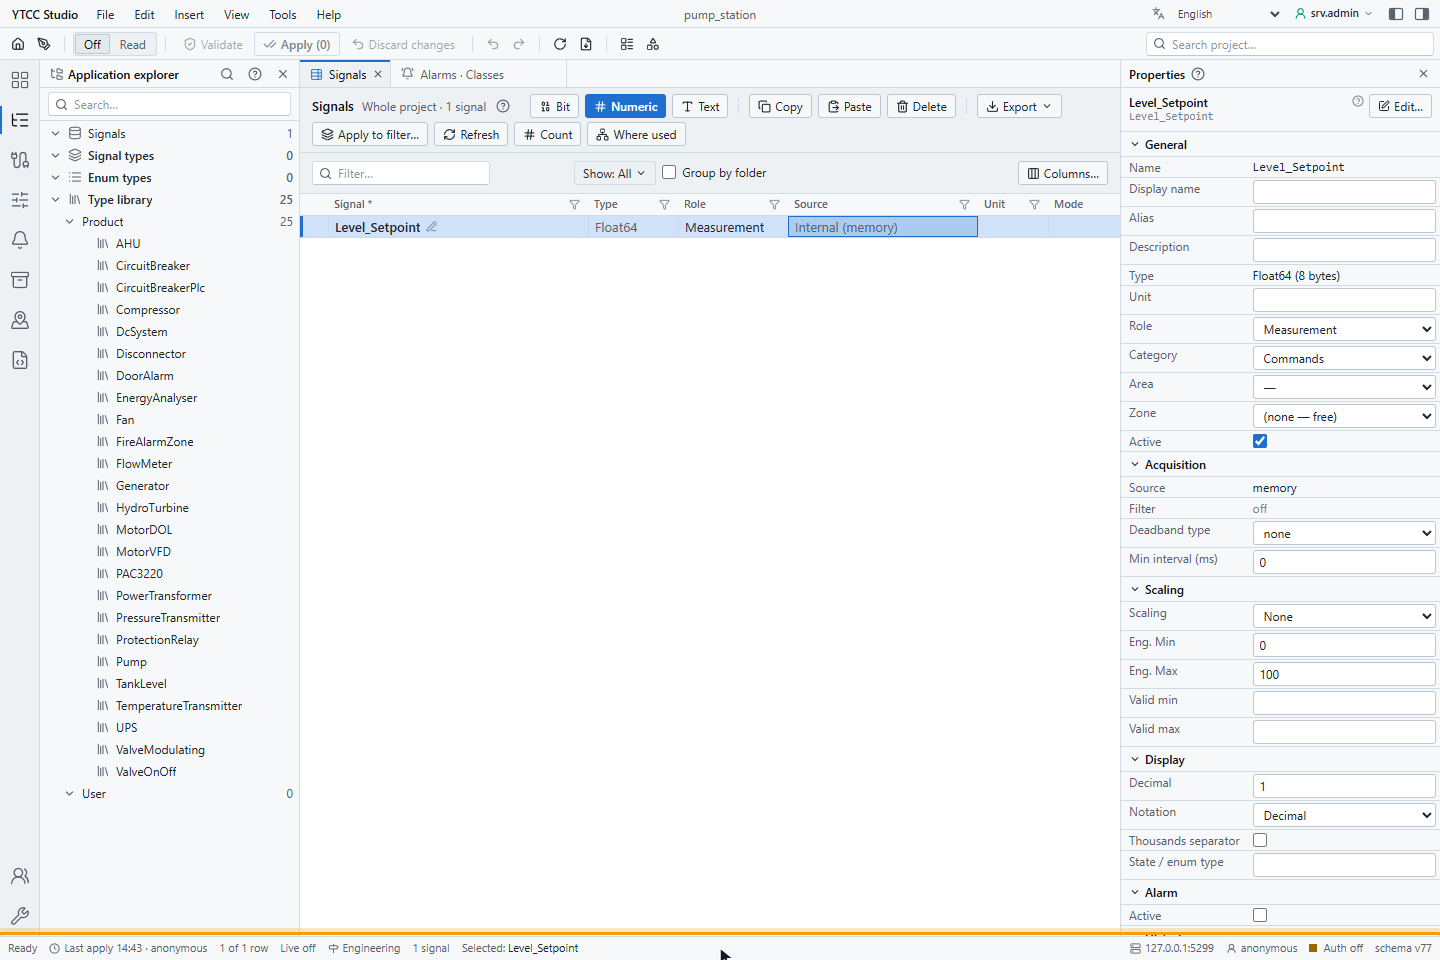
7. Read the status bar
From left to right the status bar shows:
- Ready, or the number of unapplied changes;
- Last apply with the time and the user; click it to open the restore points;
- the number of rows in the current view and the live data state, for example Live off;
- the project phase: Engineering before the project is commissioned, Commissioned after; point at it for what the phase allows;
- the number of selected rows and the selected item, for example Selected: Level_Setpoint;
- at the right the server address, the user, Auth off when user login is off, a lock with read-only when you may not change the configuration, and the schema version of the project database.
8. Search the project
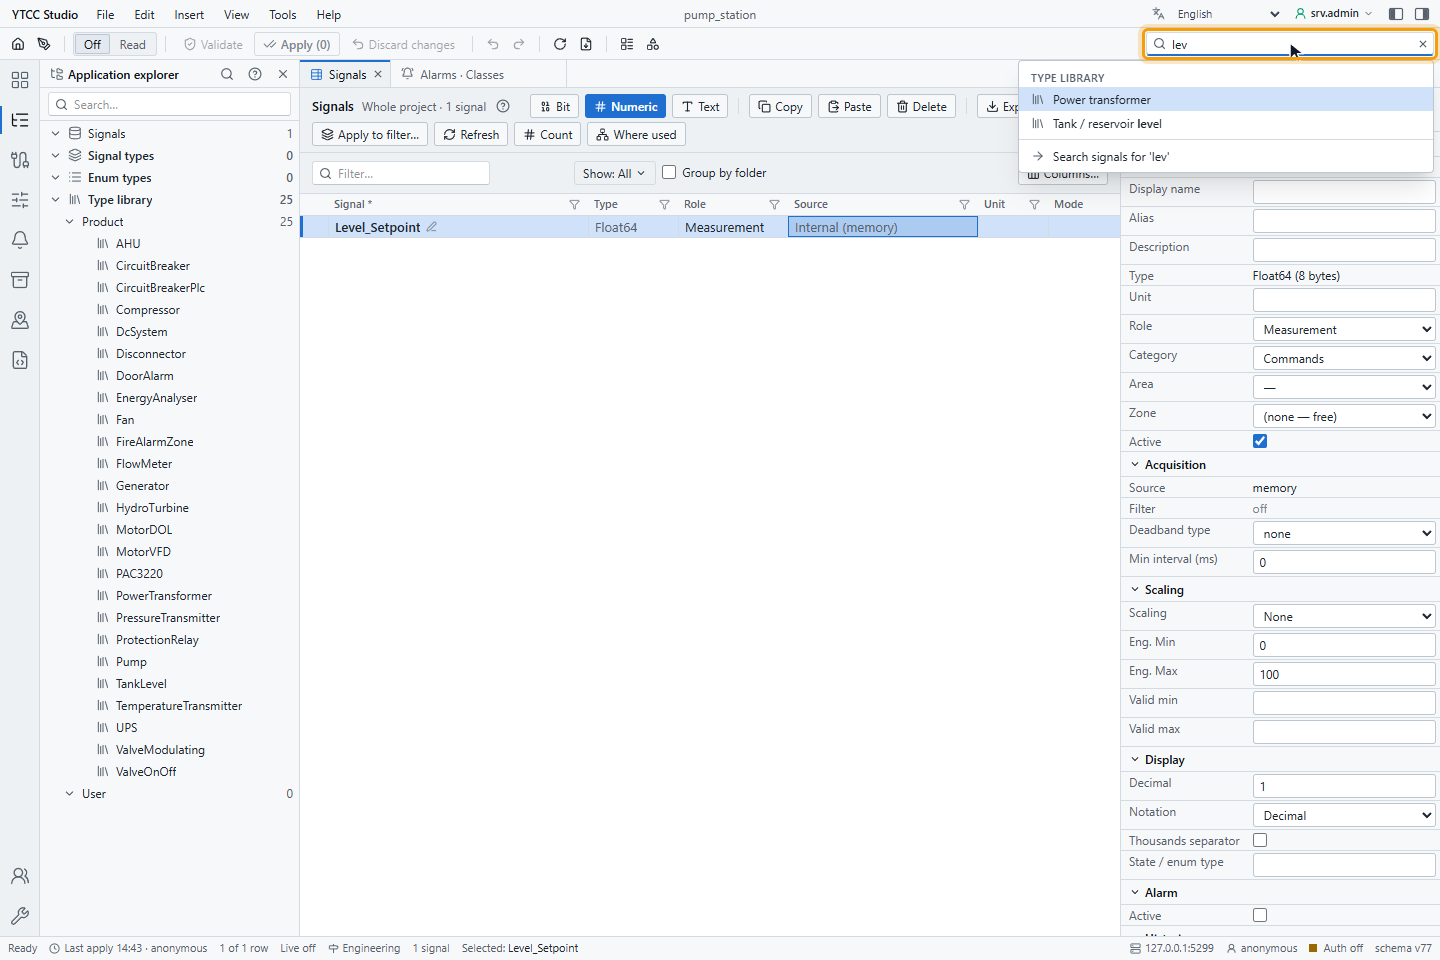
Click Search project… or press Ctrl+Shift+E and type at least two characters. The results are grouped into folders, signal types, enum types, the type library and views. The last row, Search signals for '…', searches all signals. Use the arrow keys and Enter to open a result.
9. Get help on the screen
- F1 opens Keyboard shortcuts, the list of every shortcut of the editor.
- Shift+F1 opens the help card of the place you are working in, for example the Signals list, a dialog or the Properties panel. The ? icons next to headings and fields open the same cards.
- View › Help panel shows a description of the selected signal's source.
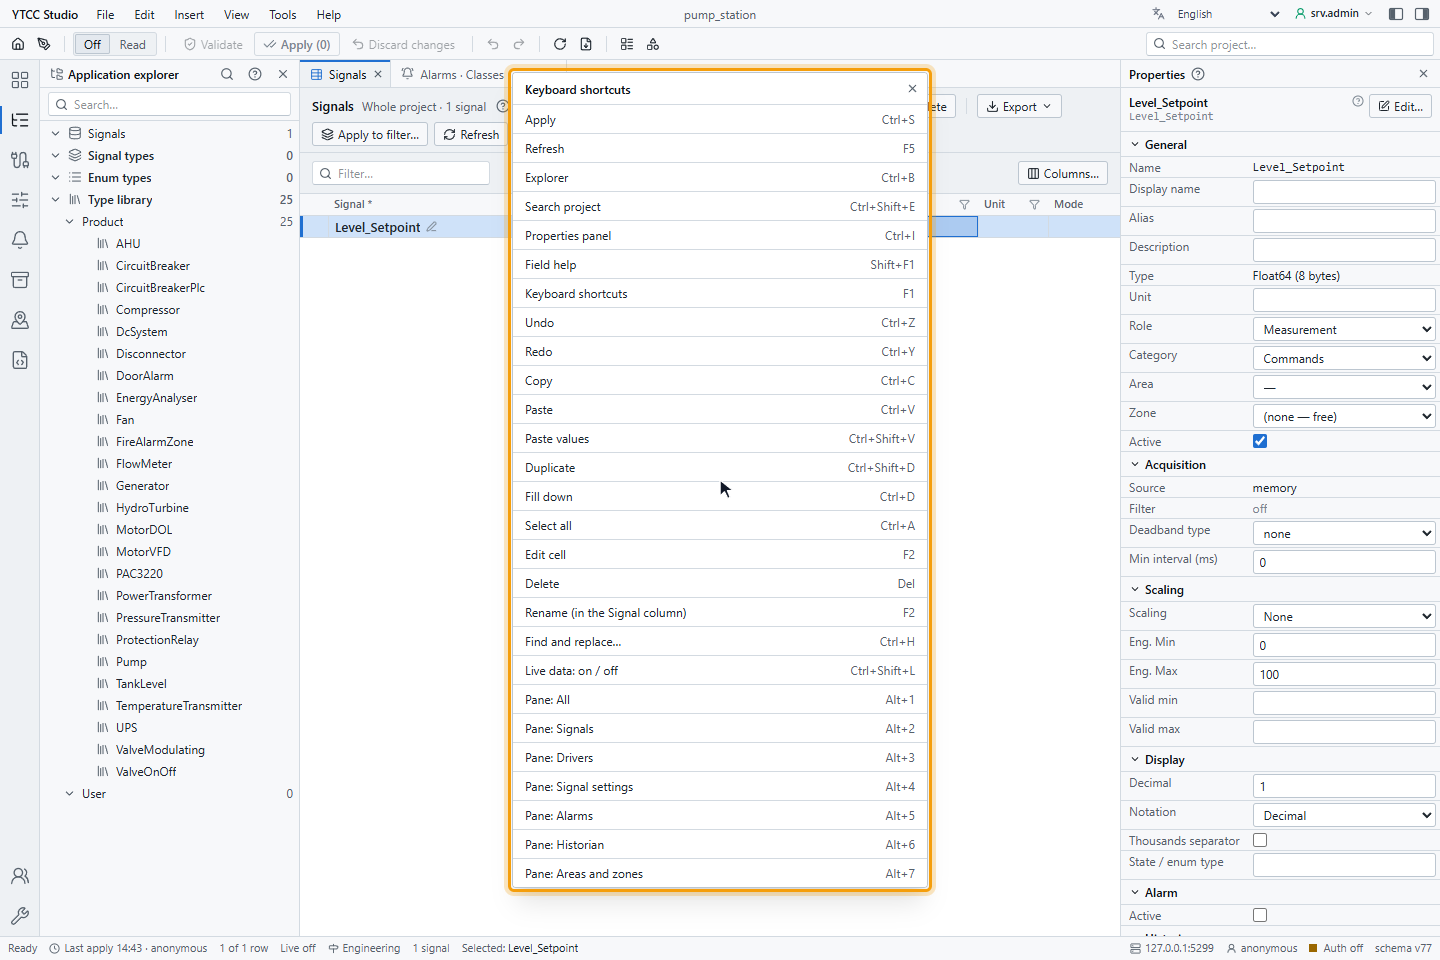
Result
You know where the views, panels and commands of the configuration editor are.
How changes are applied
Changes in the configuration editor are not saved one by one. They collect as pending changes, shown in amber in the views and counted in Apply (n) and in the status bar. Undo and Redo work on them.
- Validate checks all pending changes on the server without saving them.
- Apply (Ctrl+S) opens the same check. If there are no errors, Apply in that window saves all pending changes in one step: either all of them are saved or none. Warnings do not stop it. The window also lists the drivers that load the change without a restart and those that must restart.
- Discard changes throws away all pending changes after a confirmation.
- Every apply leaves a restore point. File › Restore point… goes back to an earlier state.
If you close the browser tab with unapplied changes, the browser asks first.
While the editor opens
While the editor loads a project, the Opening Studio window shows the project and three stages: Project settings, Signal catalogue and schemas and Workspace. A finished stage gets a tick and the running stage a spinner. Close hides the window; the editor goes on loading behind it.
If a stage takes 10 seconds or longer, the editor writes a warning to the console of the browser's developer tools, with
the stage and how long it took, and adds an entry that starts with ytcc:slow: to the performance timeline of the
browser. When a project opens slowly, these entries show which stage is slow.